
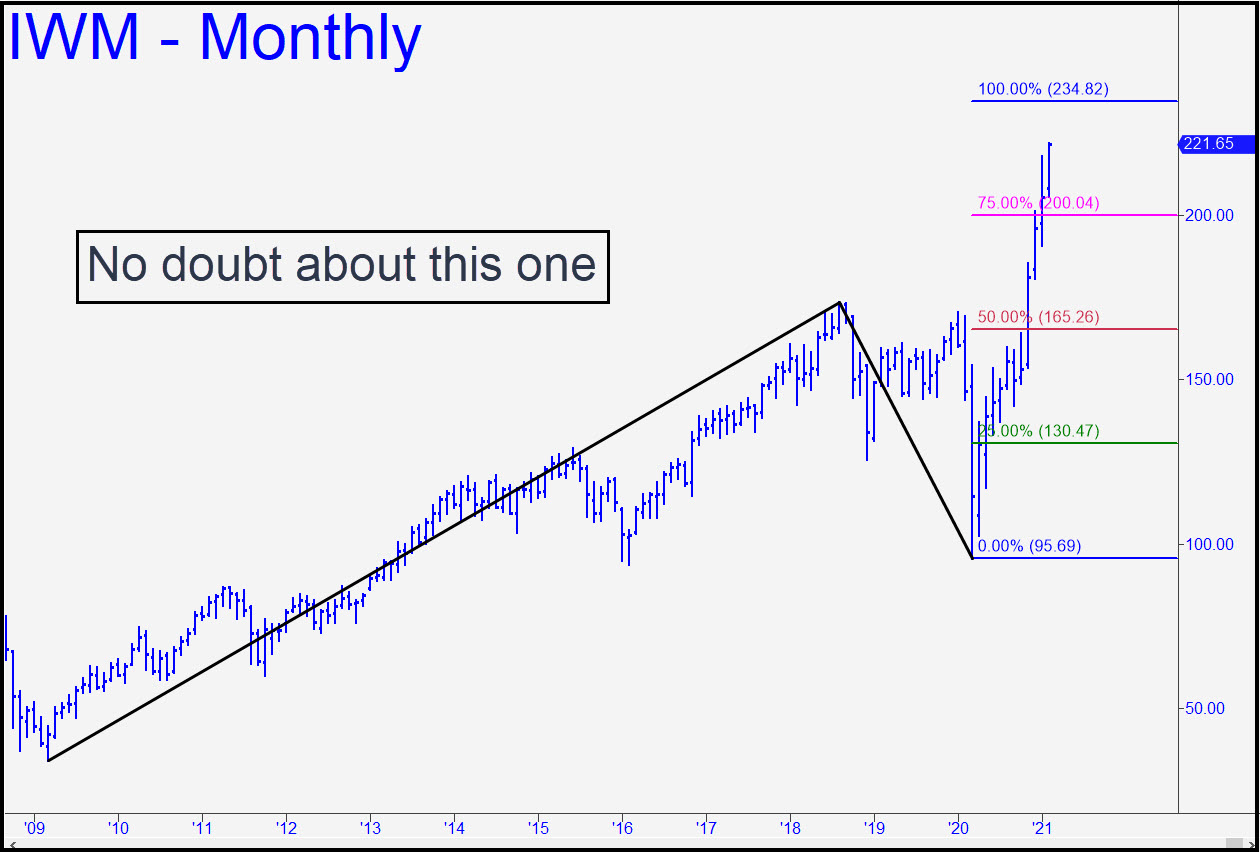
 Although I’ve identified magnetic targets in the E-Mini Nasdaq and QQQ that lie 12% above, the more modest target at 234.82 shown here, an easy 6% climb, is equally compelling and screams to be shorted. If it turns out to be a watershed top, that implies NQ and QQQ will both fail at levels midway between p2 and D that I’ve explicitly mentioned in the current QQQ tout. This target virtually maxes out logical topping possibilities on the long-term chart, since there are no lower point ‘A’ lows to be found, nor any B-C corrections that are more dramatic. Notice the decisive move through p=165.26 the first time it was hit. This makes the corresponding 234.82 target all but certain to be achieved. It also promises to be a great opportunity to lay in a supply of ultra-low-risk put butterfly spreads for maximum downside leverage when IWM gets there. Until then, all trades should begin with a strongly bullish bias. ______ UPDATE (Feb 8, 3:38 p.m. EST): For now, let’s plan on legging into some Mar 19 180/185/ 190 put butterflies. We can start with a 0.15 bid for 24 Mar 19 190/185 put spreads, adjusting that price (and possibly the date) as IWM closely approaches the 234.82 target. The spread is currently on a bid/asked of 0.22/0.30. (Note: These prices have been changed to reflect a shift to the March 19 expiration). ______ UPDATE (Feb 10, 7:57 p.m.): I never chase a trade, but I am nonetheless concerned that IWM and all broad averages will top without having quite reached my rally targets. The puts have remained out of reach in any event, so we’ll have to play it by ear. In practice, this will mean buying at least a few puts ahead of the weekend on any rally.
IWM – Russell 2000 ETF (Last:225.63)