
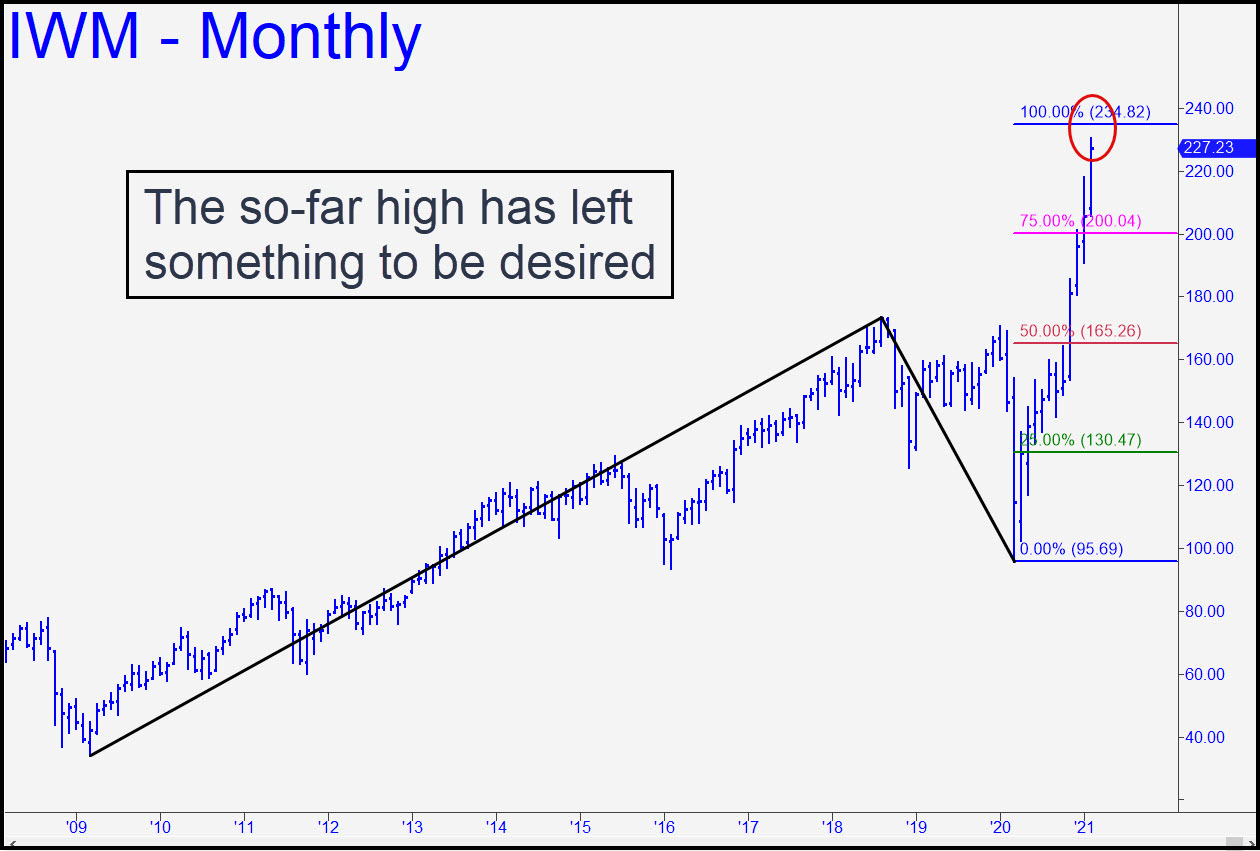
 The so-far high of this bull market has fallen just shy of a 234.82 target with a sterling pedigree. All three coordinate used to calculate the target are historical, with a point ‘A’ low located at 2009’s watershed low, and a B-C correction that brackets the market’s epic collapse a year ago. I’ll recommend waiting for Mr. Market to hand us the trade we want on a silver platter before we jump aggressively on some March 19 190/185 puts spreads. I’d originally suggested a 0.15 bid but am now advising that you buy them at will, stepping up your size at lower and lower prices as IWM gets closer to the target. Going up against a bull that is about to enter its 13th year is of course highly speculative, so don’t risk any more than you could afford to lose without pain or remorse. The pattern is very clear an compelling, with three ‘locked’ coordinates for which there are no alternatives. That is why I strongly doubt IWM will blow past the target, at least initially. There is almost certain to be a tradeable pullback from very close to 234.82, and that is what we are betting on, not the ever elusive Mother of All Tops. As always, once you’ve bought any puts spreads, offer half of them to close for twice what you paid. _______ UPDATE (Feb 18, 9:30 p.m.): Bears have fought so hard for meager yardage over the last few days that they look ready to keel over dead. Absent some sort of Sunday night shock, we might look for the broad averages to reverse and pop to new record highs next week. If so, we should keep that 234.82 target in mind as a place to get short aggressively.
IWM – Russell 2000 ETF (Last:220.56)