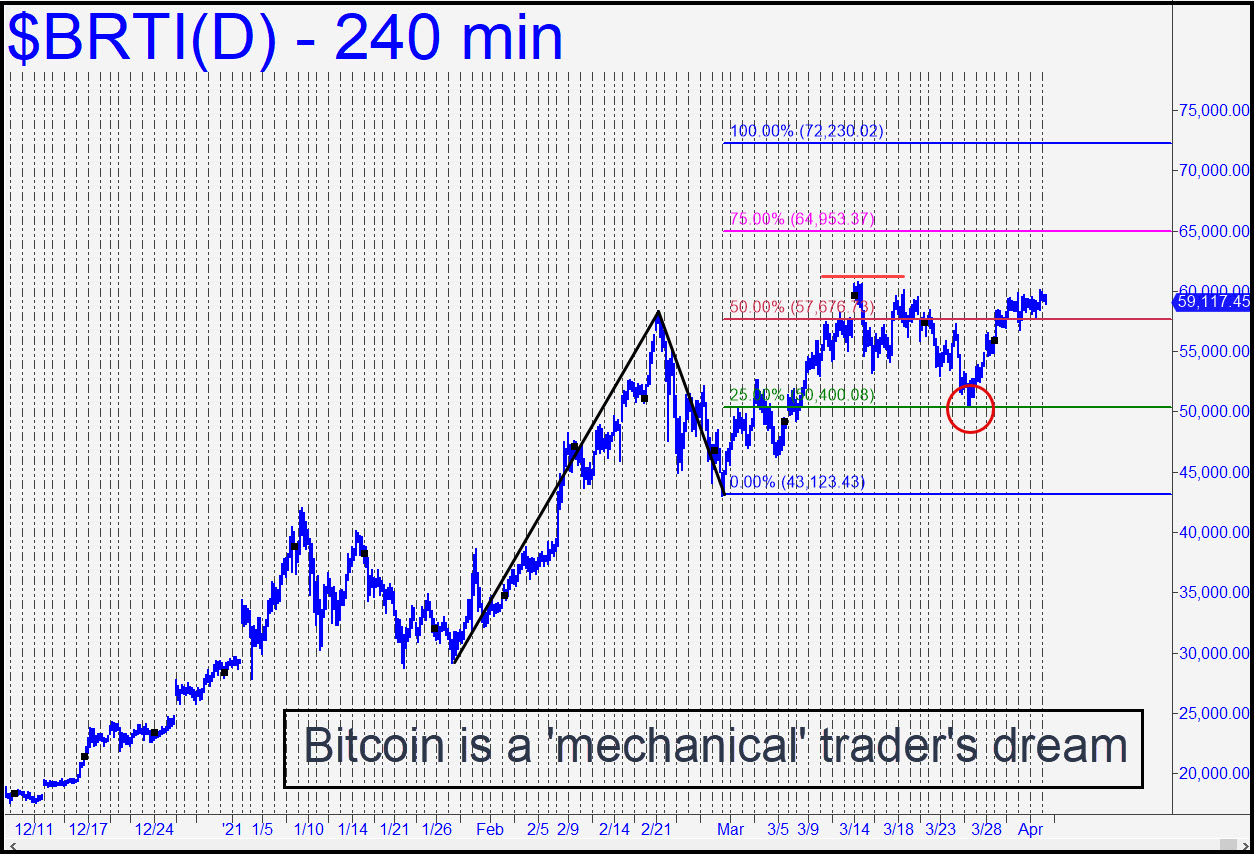
 Bitcoin has been a ‘mechanical’ trader’s dream, since virtually every buy signal that has occurred on the longer-term charts has been a winner. For your guidance, I’ve been paper-trading a 47,485 buy signal from late February that is tied to a 66,880 target. It survived a 41,500 stop-loss and was ripe for profit-taking on half the position at 57,363, a secondary (p2) Hidden Pivot that comes from the weekly chart. The new chart (see inset) shows a textbook ‘mechanical’ buy at 50,400 that occurred on March 25. Although it is too late to act on the signal, I am reproducing the graph nonetheless in order to introduce a new target at 72,230 that can take supplant the old one at 69,172. Because of the clarity of the pattern, I expect a tradeable top to occur at or very near the target. The move through p has been labored, so we should expect the remaining trek to D to be herky-jerky, if not to say tortuous. As always, a dramatic blast through the D target (72,230) on first contact would imply that seemingly fantastic prices above $100,000 are actually feasible. _______ UPDATE (Apr 14, 11:22 p.m. ET): Buyers repeatedly head-butted p2=64,953 of the pattern targeted on 72.230 but eventually gave up. They’ll be back, presumably to blast their way past this secondary pivot for a shot at 72,230. Don’t forget about D=66,880, the target of the original, long-term pattern, since it could prove stubborn.
BRTI – CME Bitcoin Index (Last:62,670)
 Posted on April 4, 2021, 5:20 pm EDT
Last Updated April 14, 2021, 11:22 pm EDT
