
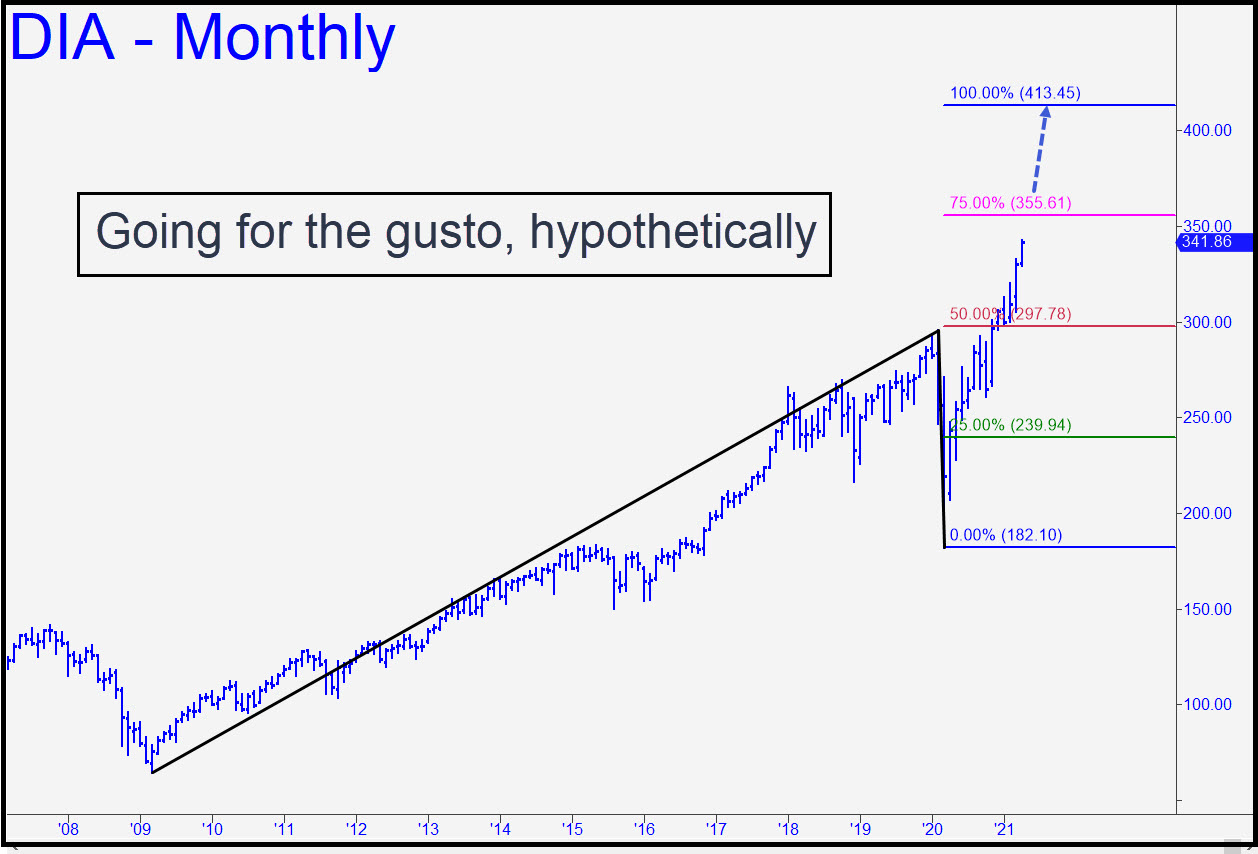
 I’ve stretched the pattern to produce a 413.45 target that maxes out the monthly chart and which is roughly congruent with a long-term target at 4905 in the E-Mini S&P. The pattern uses a ‘marquee’ low for point ‘A’, which is not ideal. In this case, however, it seemed logical in preference to either of the indistinct, one- and two-off lows recorded in 2010 and 2011. Bulls have pushed past the 297.98 midpoint resistance with authority, shortening the odds that D=413.45 will be reached. For now, though, the secondary pivot (p2) at 355.61 can be used as a minimum upside objective. I will be closely monitoring price action there to gauge how much buying power remains. There may be an opportunity to get short at p2, so stay tuned to the chat room or your email ‘Notifications’ if you care. _____ UPDATE (Apr 20, 6:36 p.m. ET): Weakness stretched into a second day. This is somewhat unusual these days, but a third ‘down’ day would be almost freakish. Wait and watch! _______ UPDATE (Apr 21, 8:16 a.m.): DIA has receded slightly from Monday’s all-time high. If this is a Titanic disaster in the making, the ship has just left Liverpool. ______ UPDATE (Apr 21, 5:06 p.m.): Three straight down days? The odds are better that the sun will fail to rise in the East tomorrow. The lesson is that you’ll have a hard time losing money if you take home a long position at the end of a second straight down day on Wall Street. ______ UPDATE (Apr 22, 10:09): It’s refreshing to imagine that today’s moderate selloff was the start of a catastrophe, but I doubt it. The 345.33 rally target in this chart looks all but certain to be hit, given the gap through p=332.98 on the first try. The target should work nicely for getting short with a ridiculously tight stop-loss — and don’t be afraid to buy puts that only have a week or two left on them.
DIA – Dow Industrials ETF (Last:338.12)