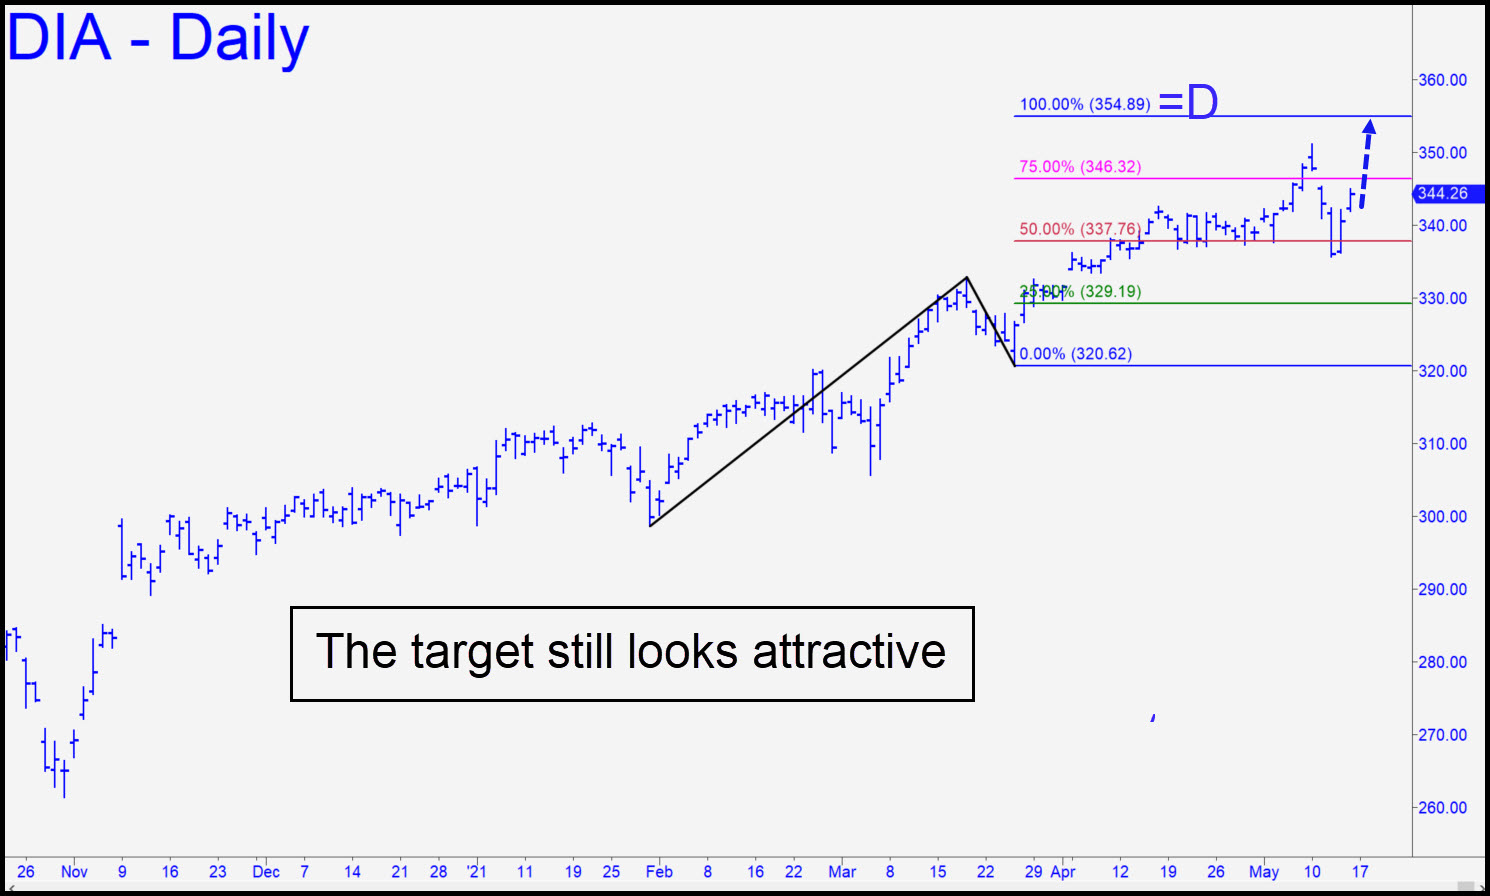
 I still like the 354.89 Hidden Pivot target that has served as our lodestone since early April. The pattern to which it is tied is somewhat gnarly, although not quite gnarly enough for us to assume we would be alone shorting at ‘D’. The target is particularly enticing nonetheless because with DIA at that height, bears would be caught in a murderous short squeeze while bulls would be giddy. A perfect storm, perhaps? Regardless, we should look to get short at a top that occurs just below D, and to extract what we can in the meantime from the implied rally to it. We should also be alert to a possible trend failure somewhat shy of last week’s record 351.09, since virtually everyone will be expecting it to be breached or at least tested. _______ UPDATE (May 18, 11:13 p.m. ET): The close beneath the green line implies DIA is bound for at least p=337.24. With a little more weakness, this could be the first time in a long while that we’ve had a pattern suitable for getting short ‘mechanically’. Here’s the chart. ________ UPDATE (May 19, 10:56 a.m.): Having crushed the 337.24 midpoint Hidden Pivot that was our minimum downside target, DIA is now a shoe-in to hit 329.55, the ‘D’ target of this pattern. A rally to the green line — x=341.09 — would trigger a very appealing ‘mechanical’ short, stop 344.94.
DIA – Dow Industrials ETF (Last:344.26)