
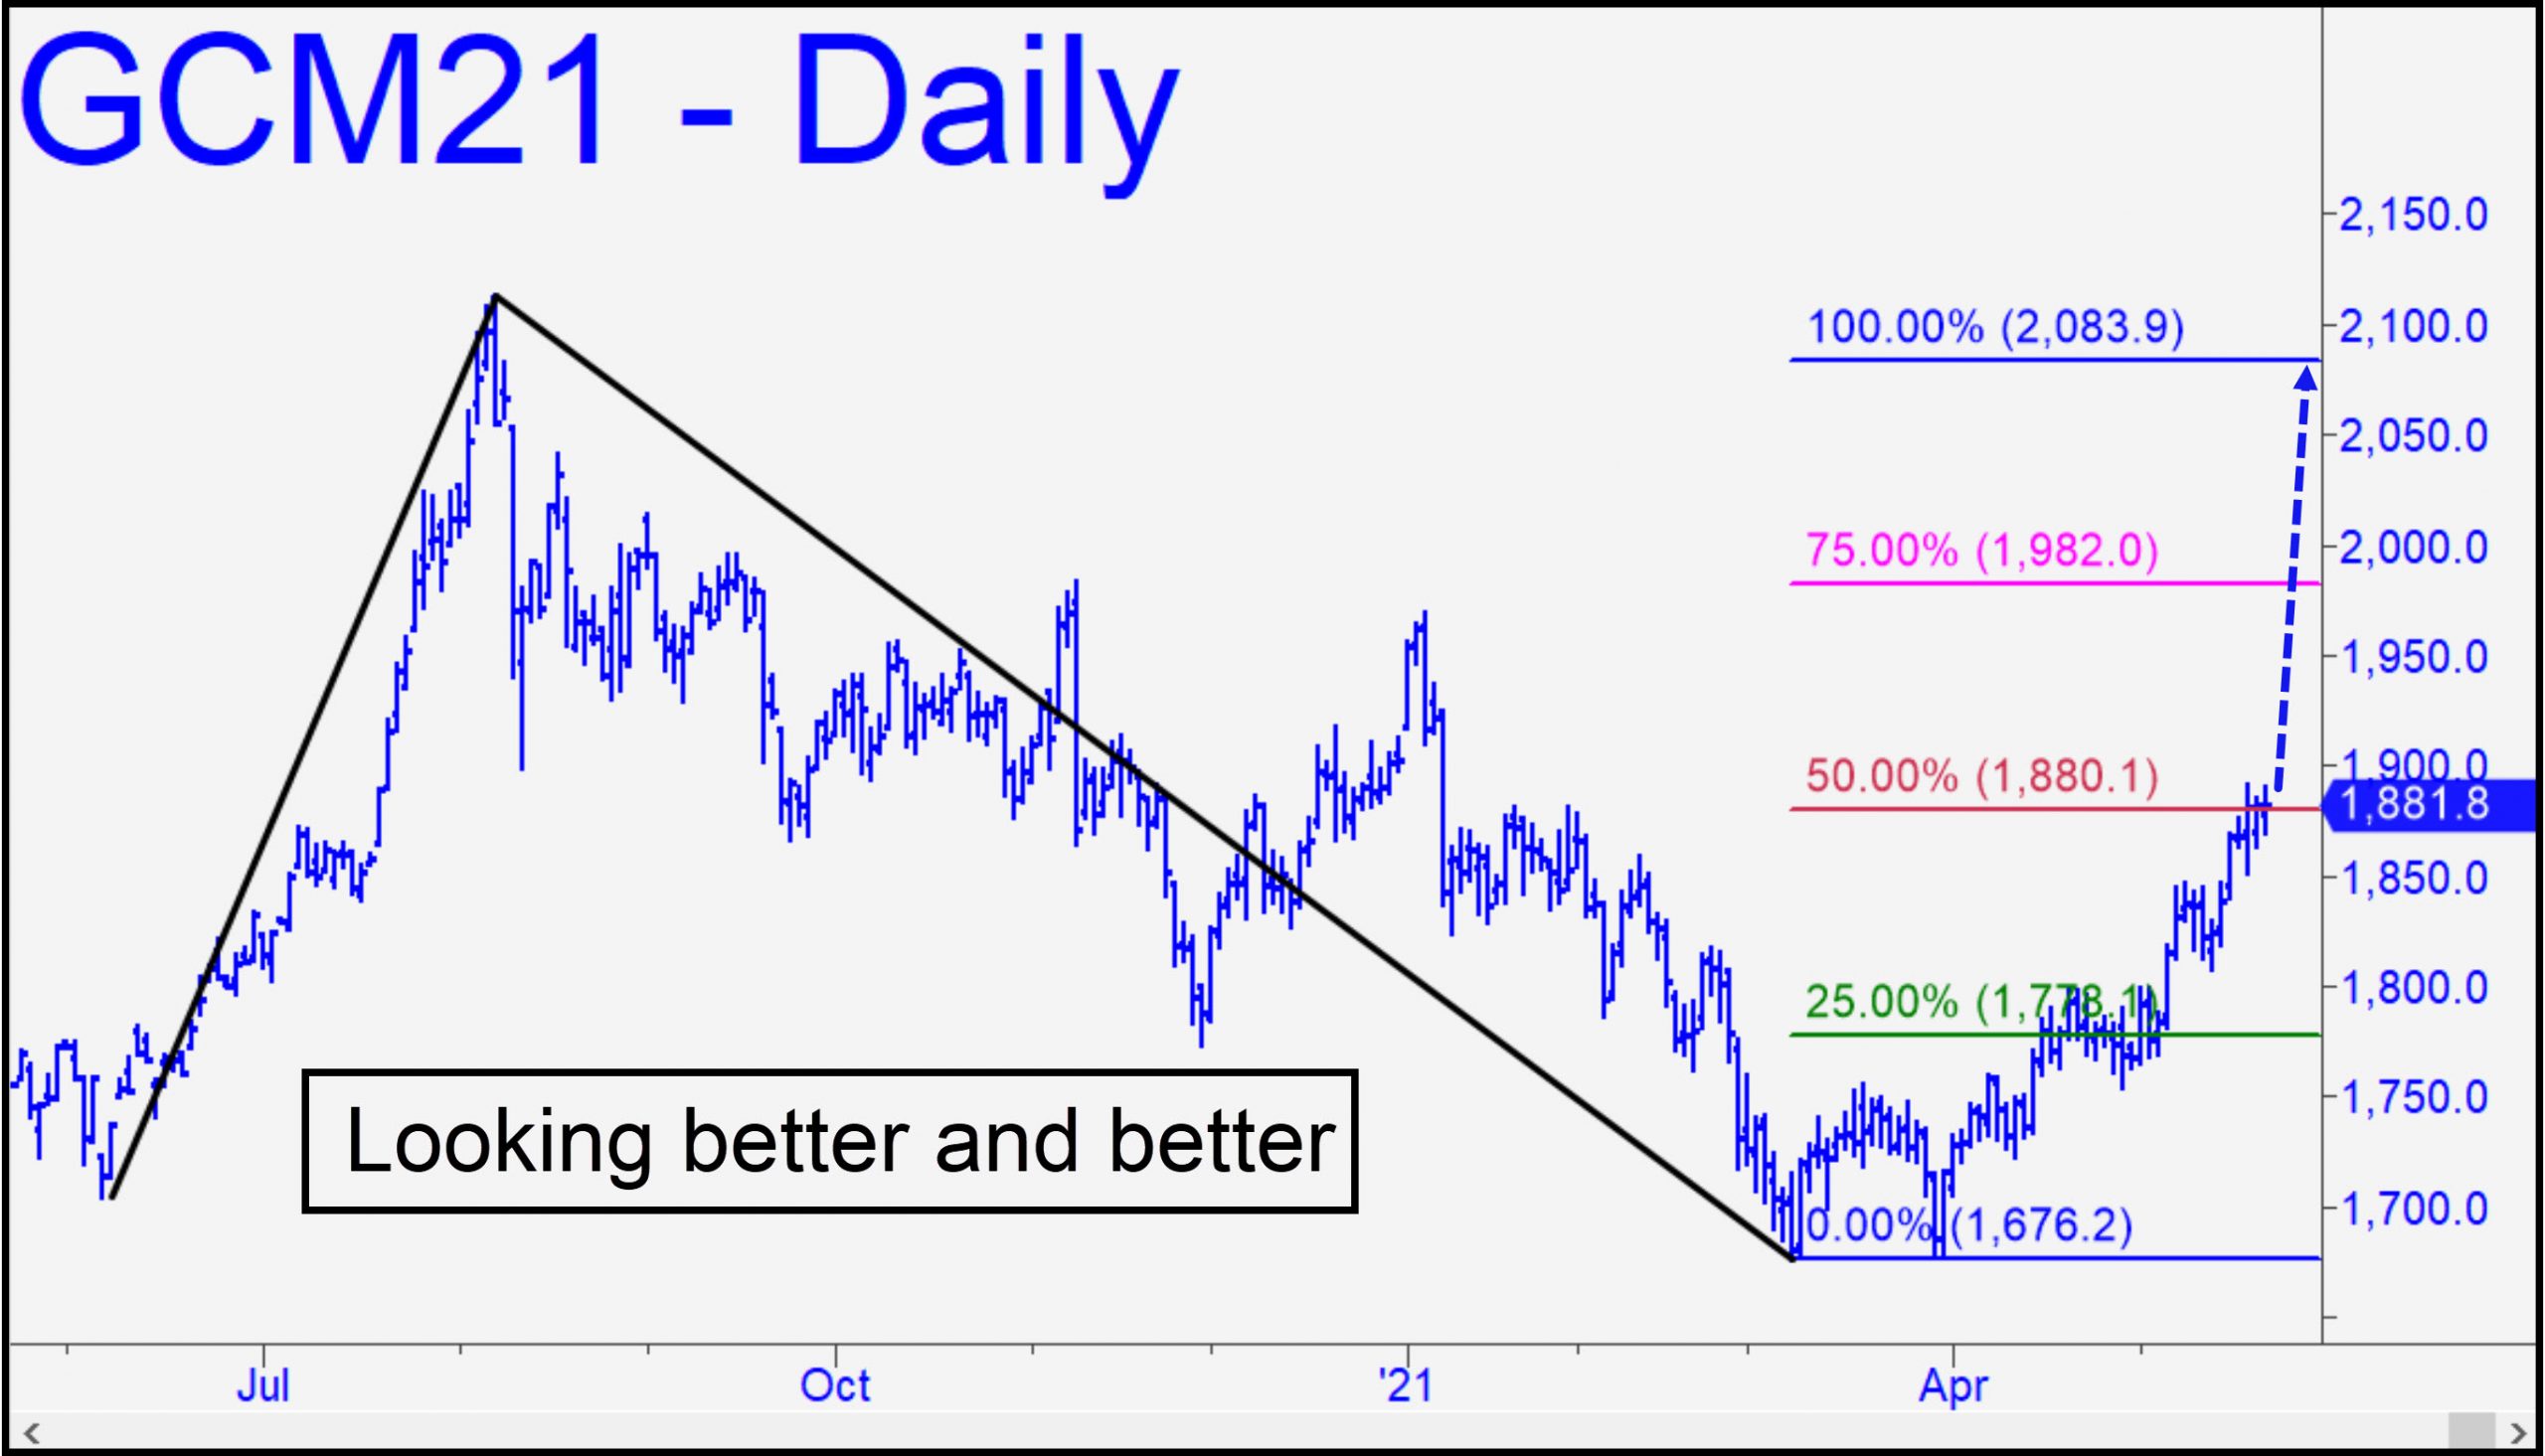
 June Gold has consistently been exceeding minor targets while showing increasing resistance to the $50 takedowns that have plagued bullion since last summer. This gives me increasing confidence that the 2083.90 target shown will be achieved. It was first broached here six weeks ago, a feature of a bullish ‘reverse ABC’ pattern that looks unlikely to fail us. That means not only that the levels can be used for ‘mechanical’ entries, but also that last week’s penetration of p=1880.10 was undeniably bullish. Notice that the thrust also took out two ‘external’ peaks from January, adding further evidence that the bozos who have impeded gold in its role as an inflation hedge are finally starting to smarten up. This is good news for gold bugs, though not so much for lovers of bitcoin. ______ UPDATE (May 25, 10:51 p.m. ET): June Gold was wafting effortlessly higher late Tuesday, having pushed through round-number resistance at 1900 with little hesitation. The futures looked bound most immediately for the 1918.60 target shown in this chart, but an easy move past it would telegraph still more upside over the near term. _______ UPDATE (May 27, 5:58 p.m.): We’ll use the pattern shown, with a 1944.90 target, for the time being. The futures would trip a ‘mechanical’ buy signal on a pullback to x=1882.70, but because initial risk would be more than $2000 with the required stop-loss at 1861.90, I’ll recommend the trade only to those who are able to cut it down to size with a ‘camouflage’ set-up. _______ UPDATE (May 28, 11:06 p.m.): The trade worked perfectly off a textbook-perfect pattern that has produced a so-far gain of around $1700 per contract. The trampoline bounce followed an 1880.90 low just 80 cents beneath the suggested bid. In practice, the trade would have produced a quick and substantial gain no matter what tactic you used to get long. Here’s the chart.
GCM21 – June Gold (Last:1896.30)