
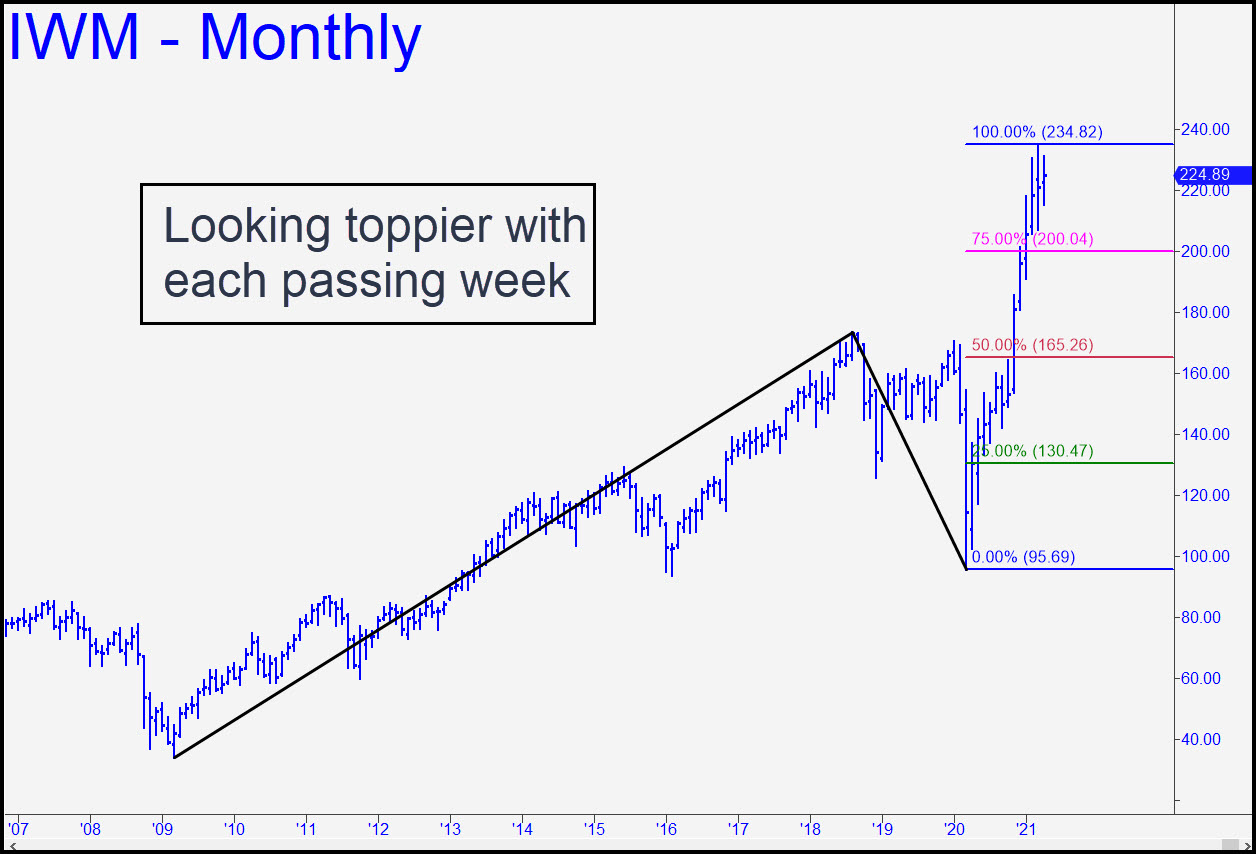
 For hopeful bears, so far so good. IWM is looking increasingly toppy for two reasons: 1) a menacing head-and-shoulders pattern veered south on Friday just as it was about to get timed out; and 2) the ETF has failed so far to push above a very long-term target at 234.82 that was first hit — very precisely — six weeks ago. Taken together, these signs of weakness have placed the burden of proof on bulls. They could still knock bears on their ass with a close this week above last week’s high, but until such time as that happens we should maintain a bearish trading bias. If you still hold any put butterflies, please let me know in the chat room so that I can provide further guidance. ______ UPDATE (May 3, 10:04 p.m. ET): Subscribers reported butterfly positions centered on the 180 strike and expiring around mid-July. These puts spreads were purchased for around 0.15, so there is little at risk. For now, do nothing further. ______ UPDATE (May 4, 4:51 p.m.): Sellers etched more shapeliness into an increasingly bearish right shoulder of the H&S pattern noted above. If it fulfills its potential, we should see a drop over the next 5-8 days to around 205, where the left shoulder began. Here’s an updated chart.
IWM – Russell 2000 ETF (Last:223.29)