
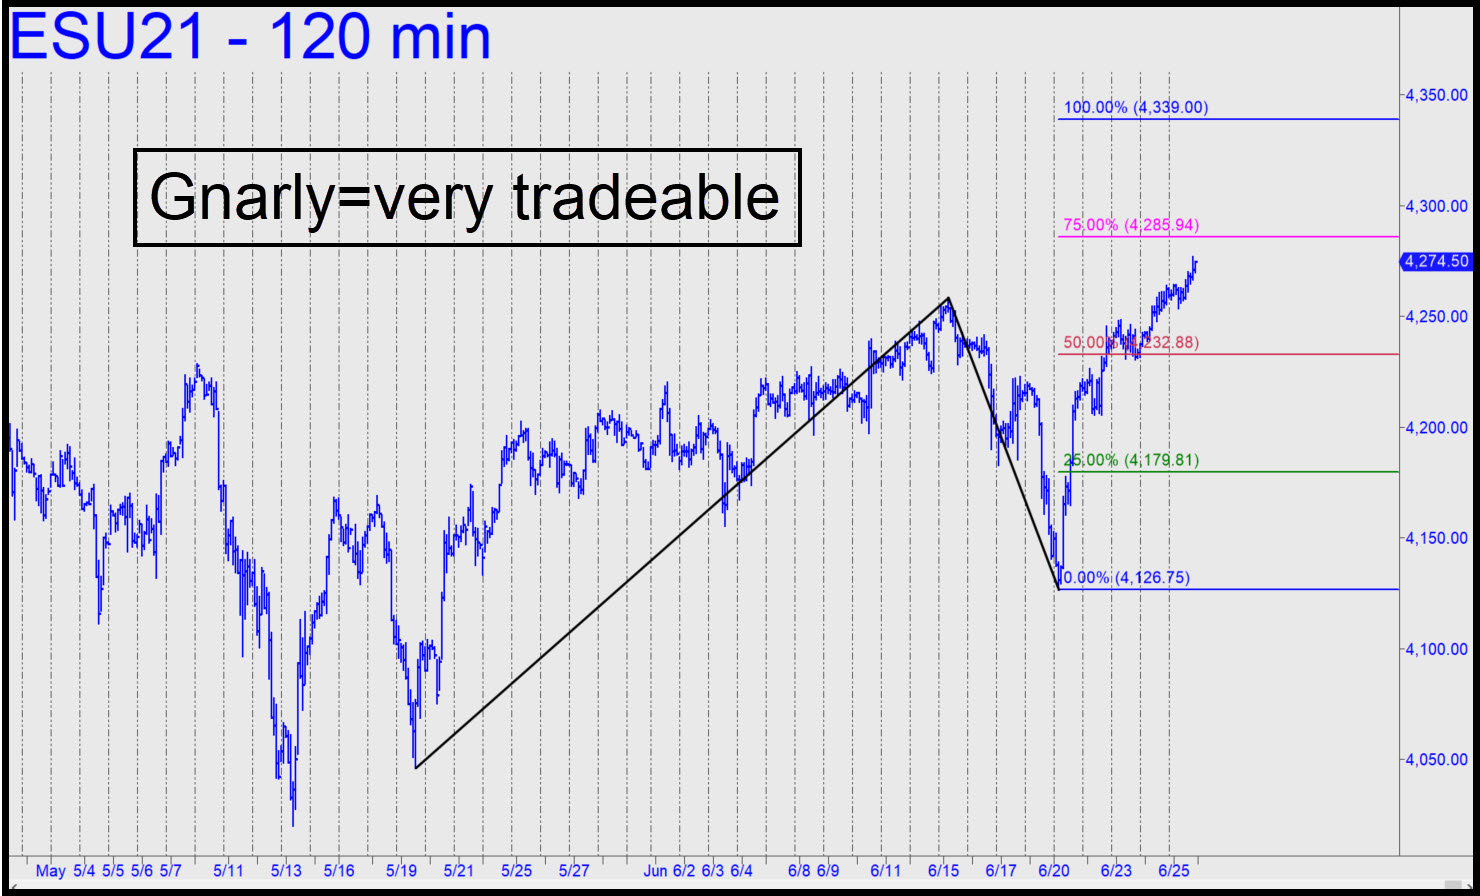
 I’ve moved the point ‘A’ low of the recent pattern down a notch, a change that has effectively raised the short-term rally target by 30 points to 4339.00. The pattern is gnarly enough that you can short there with a tight stop, but I am recommending this only to subscribers who have made at least a few bucks on the way up. A pullback to p=4232.88 can be used to get long ‘mechanically’ in the meantime, even if the requisite swoon seems unlikely. A bid there would take a stop-loss at 4197.25. One last possibility: shorting p2=4285.94. I’d suggest using a ‘reverse ABC’ pattern to accomplish this, with an a-b segment no longer than 30 points. That would imply initial risk of around $375 per contract. _____ UPDATE (Jun 28, 10:25 p.m. ET): Mr Market is toying with us, pussyfooting all day long just a tad shy of the 4285.94 print we need to set up the short detailed above. It seems clear that he will continue to jack us around, stopping the short out two or three times if he has to, if I continue to insist on using a piddling 30-point a-b segment to get the trade rolling. However, when I give the ‘x’ trigger more room with this 93-point ‘a-b’, and then plant my ‘c’ high at today’s 3282.00 peak, it would trip a short at 4258.50. Thereafter. a successful trade would have to fall to at least p=4235.38 from there so that half the short could be covered, and you can judge for yourself whether that looks likely. In so doing, we are not applying any explicit rule or set of rules, but rather a visually intuitive judgment that looks like a winner. (I rate the trade a succulent ‘7.8’ — not bad for a night’s work.) Initial risk would be $1163 per contract theoretical, and you should initiate the trade with at least two contracts so that you’ll have half the position left for a swing for D=4188.75. More risk to be sure, , but there is denying it ‘looks’ like a better trade than trying to save $300-$400 by executing with the 30-point ‘a-b ‘ segment I’d suggested initially. ______ UPDATE (Jun 29, 10:15 p.m.): The ratcheting short-squeeze continued, creating a new high at 4291.00. If it stands, the rABC short would now trigger at x=4267.50, shown in this chart. ______ UPDATE (Jun 30, 8:32 p.m.): You can forget about that one. I’d offered a ‘reverse ABC’ set-up to accommodate subscribers who were enthused about shorting Farmer’s 4289.66 target. It turned out to have been just a fleeting, minor top among a recent dozen, and it is now being unceremoniously trashed by insatiable buyers. For now, use the 4313.25 target shown in this chart to leverage a bullish bias. Notice that the pattern has already triggered a quite profitable ‘mechanical’ entry at the green line and has room to do it again at p=4288.75. ______ UPDATE (Jul 1, 2:20 p.m.): Anyone who ‘did it again’ — i.e., got long ‘mechanically’ on the pullback to p=4288.75 — could have reaped an overnight profit of $2600 by simply exiting on this morning’s anticipated rally to p2=4301.00. _______ UPDATE (Jul 1, 6:29 p.m.): The futures got within five ticks of the 4313.25 rally target sent out last night. Because they have yet to interact with it, however, I can’t offer the usual roadmap for tomorrow. In any event, the pattern served us well, allowing me to craft the ‘mechanical’ buy at 4288 that produced a no-doubt-about-it theoretical gain of at least $650 per contract.
ESU21 – Sep E-Mini S&P (Last:4310.50)