
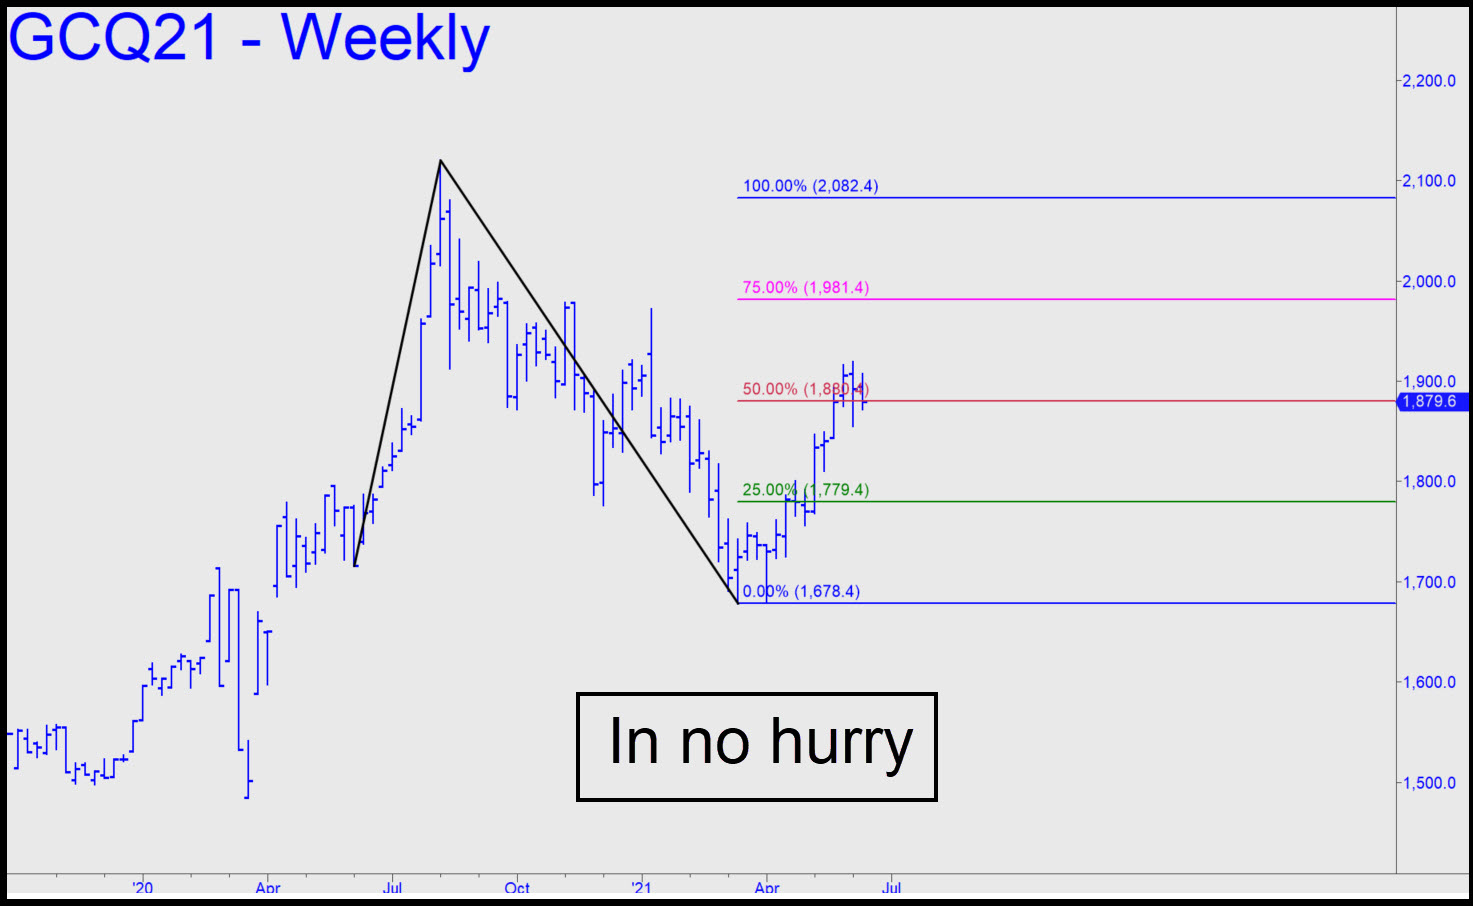
 Gold turned leaden last week, although it managed to hold its own against the takedown artists. Buying interest in bullion was nil as the action shifted back to the lunatic stocks. Usually that begets a gratuitous $100 swoon in gold, but DaBoyz evidently couldn’t round up the few sellers it would have taken to accomplish this. The result was another week’s consolidation at an 1880.49 midpoint pivot associated with a rally target, previously given, at 2082.40 (see inset). Bulls were on the run at the close, however, so here’s a downtrending ABC pattern you can use to judge whether the selling is likely to continue. It tripped an enticing ‘mechanical’ short on the bounce to the green line (1892.70), but I doubt the futures will fall as far as the 1850.20 target. If they do, you can bottom-fish there with a tight stop-loss, good till 10 a.m. ET Monday. _____ UPDATE (Jun 14, 10:18 a.m. ET): The trade recommended above worked nicely, producing a gain so far of up to $7600 for anyone who got long at 1850.s0 as advised. Here’s the chart. A stop-loss at 1845.60 or lower would have held the position. Use a target of 1880.10 for what remains of your position. That is ‘d’ of this rabc set-up on the 60-minute chart: a=1871.80 on 6/10 at 9:00 a.m. ET. _______ UPDATE (Jun 16, 12:25 a.m.): The pullback to x=1854.3 generated a mechanical ‘buy’, but the trade would have been exited on the run-up to within an inch of p=1862.90. I have nothing more to suggest at the moment. ______ UPDATE (Jun 17, 1:13 a.m.): There was no reason for gold to sell off with stocks on the non-news from the Fed, but the fact that it did anyway suggests DaSleazeballs have more control over it, at least for short periods of up to a day or two, than I had previously imagined. It is mildly bearish that the plunge exceeded the 1811.50 target of this pattern. _______ UPDATE (Jun 17, 5:55 p.m.): The thrashing gold has taken during the last two days has created two possibilities. Here’s the bullish one, with a ‘mechanical’ buy signal at 1779.40, stop 1678.30. And here’s the bearish chart, which shows a light breach of a crucial midpoint Hidden Pivot support at 1772.70. We’ll be better able to judge which is more likely to hold sway over the next 3-5 weeks after we’ve seen more interplay between the futures and the support. For now, though, my long- and intermediate-term bias remains bullish.
GCQ21 – August Gold (Last:1774.80)