
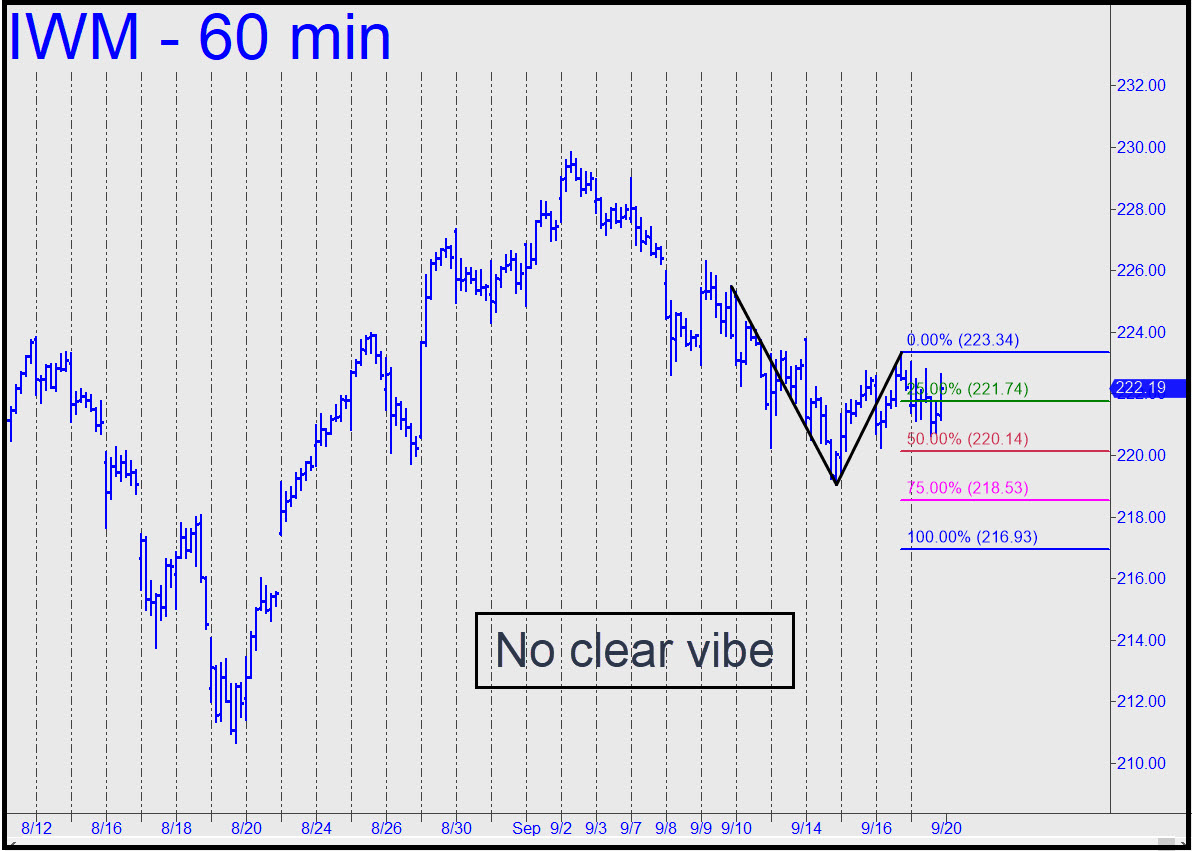
 Bears seem to be struggling more than bulls, implying the next move will be up rather than down. This is out of kilter with just about everything else I track, however, so I’ll suggest using the bearish pattern shown, at least for the time being, to set up trades and gauge trend strength. Most immediately, I like the odds of bottom-fishing with an rABC pattern anchored midway between p and p2 (i.e., at around 219,35). This is intended as a day-trade, since the countertrend will not get very far if the broad averages continue to act weak. _______ UPDATE (Sep 20, 12:41 p.m.): IWM opened on a gap well beneath my prospective ‘c’ low, negating the trade. The fact that it has relapsed to crash the pattern’s ‘D’ target is not a sign of good health. Sliding point ‘A’ up to Sep 7’s 229 high yields a new target at 213.41. Given the way the downtrend crushed ‘p’. further slippage to at least D=213.41 is all but inevitable, and your trading bias should therefore remain bearish. Here’s the chart. _______ UPDATE (9:57 p.m.): The nasty bounce has come from a low that fell somewhat shy of the 213.41 target. I still regard a relapse to this Hidden Pivot as likely, so I’ll suggest shorting p=218.38 with a 220.03 stop-loss. ______ UPDATE (Sep 21, 10:20 p.m.): The ‘mechanical’ trade suggested in the last update worked perfectly, producing a quick $996 gain on 400 shares early in the session. No one mentioned it in the chat room, so I did not established a tracking position. Here’s a chart that illustrates how the trade worked. (Note: You could still be short 25% to 50% of the original position, shooting for D or lower.) _______ UPDATE (Sep 22, 9:31 p.m.): We’re at three days and counting as we wait for IWM to generate a bullish impulse leg on the hourly chart. Today’s rally missed by an inch, and that is not exactly a sign of robust health. It smells like distribution, actually, but I’m not ruling out the possibility that DaBoyz could goose this vehicle into a more persuasive bear rally if they can get shorts to panic. _______ UPDATE (Sep 23, 9:42 p.m.): Today’s short squeeze rally generated a bullish impulse leg on the daily chart. Big deal. Now it’ll take a print at 229.94 to turn the daily chart impulsive. Please wake me if that happens.
IWM – Russell 2000 ETF (Last:224.82)