
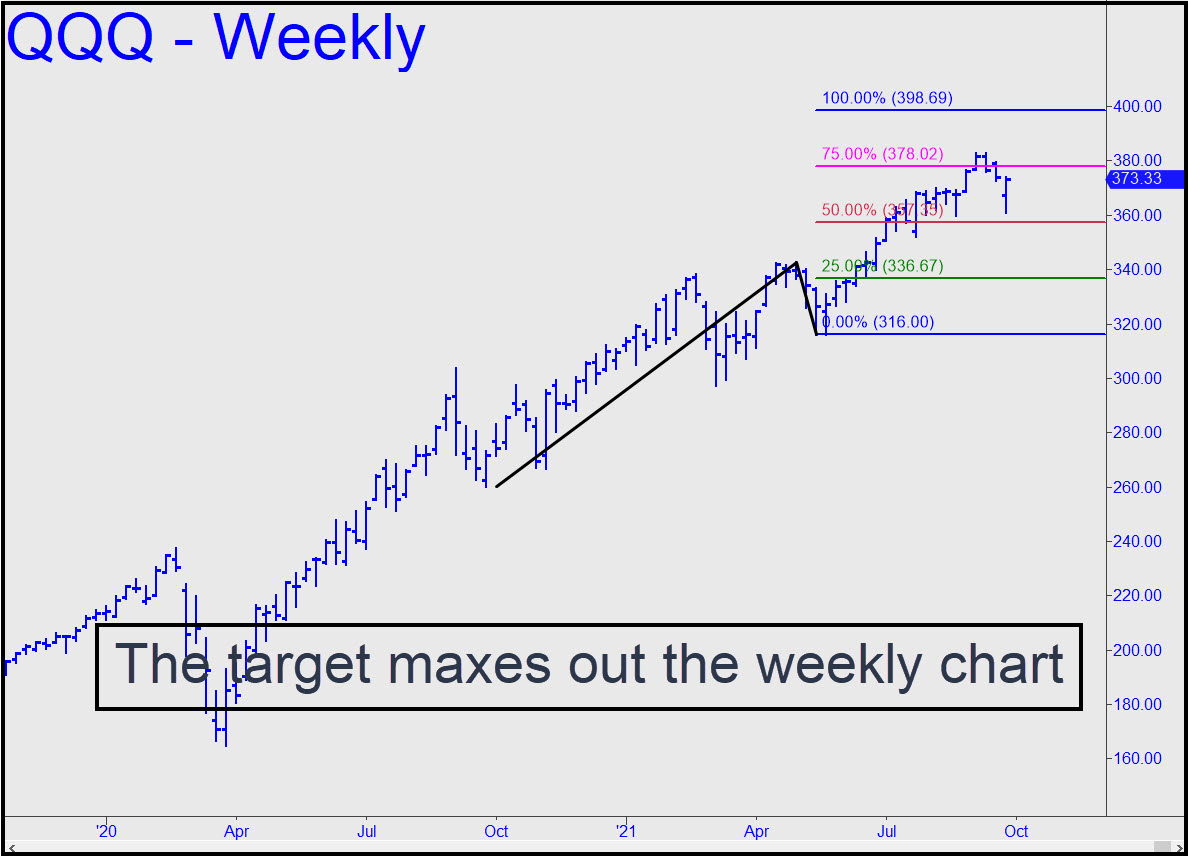
 The 398.69 rally target shown maxes out bullish targets that can be projected using the weekly chart. It would trigger a ‘mechanical’ buy on a pullback to p=357.35, stop 343.57; or, somewhat less risky, at the green line (336.67), stop 315.99. My hunch is that the first trade, if it triggers, would likely visit pain on buyers without stopping them out. To reduce the entry risk, I’d suggest crafting a ‘camouflage’ set-up on the hourly chart or lower if and when the red line is touched. The target cannot be considered a done deal because the initial push past p was tentative, and the elongated A-B impulse leg was weakened by a detour last spring. Even so, given that the Cubes are still a favorite vehicle for the lunatic fringe, we should always give the benefit of the doubt to the bull trend. If it continues into outer space, here’s a chart with a target at 478.87 that is congruent with another huge leg up in this ageless bull market. ______ UPDATE (Sep 26, 5:12 p.m.): The plunge through p=365.06 all but guarantees more downside to at least D=356.07. Let’s see how resilient this ‘hidden support’ is. Pivoteers can try bottom-fishing in any event with a tight rABC trigger. ______ UPDATE (Sep 30, 6:25 p.m.): Don’t look for much of a bounce from 356.07 if it happens at all. I’ll be looking to try a very tight rABC ‘buy’ from just above 356, but even if the trade makes money, I don’t expect the low to hold.
QQQ – Nasdaq ETF (Last:357.96)