
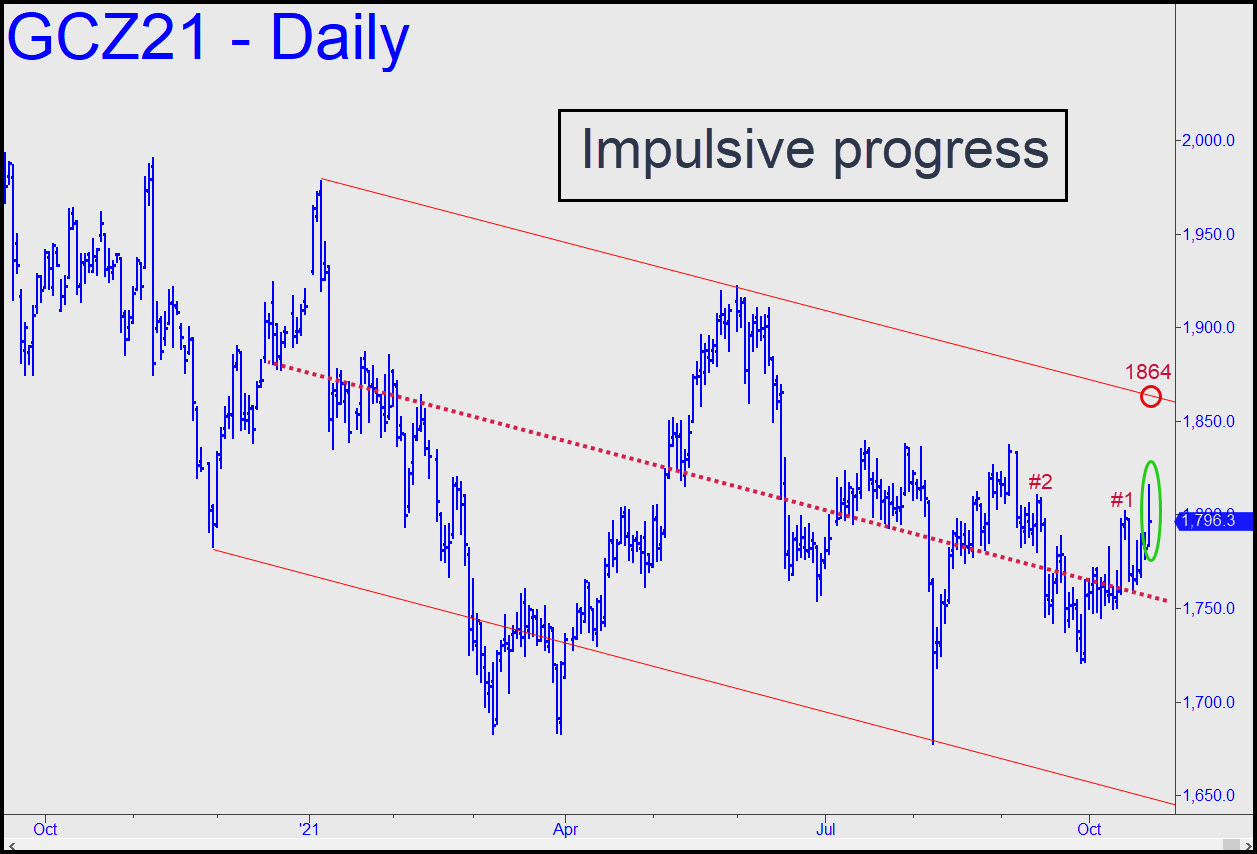
 Bulls made encouraging progress last week with a spike on Friday above two prior peaks — an ‘internal’ and an ‘external, the minimum required to generate an impulsive leg. This will shorten the odds of a move to the upper line of a channel I’d drawn last week. It comes in at around 1864 and has a downward slope of about 35 cents per day. When the week began, my bias was mildly bearish, but this latest price action has tipped me bullish, That’s notwithstanding the fact that gold closed well off the high. That was to be expected, since the high occurred a hair below the ‘D’ target, on the daily chart, of A= 1745.40 (10/6). Sliding ‘A’ down to 9/29’s 1721.10 low yields a new rally target at 1841.10. If reached that would be quite bullish, since it implies a breakout above three imposing peaks near 1836 recorded over the summer. Keep an eye on price action at p2=1820.90, since a stall there, precisely, could be prelude to a sharp reversal per ‘Matt’s Curse’. In the meantime, a pullback to x=1780.50 would trip a ‘mechanical’ buy signal, stop 1760.20. With $8000 initial risk on four lots, this one is recommended only to those who know how to cut the risk by as much as 95% with a ‘camouflage’ set-up. _______ UPDATE (Oct 25, 5:10 p.m.): I’ve made a slight correction in the chart that brings our target down a smidgen to 1840.30, with corresponding changes in x, p and p2. I’ve done so because the pattern is gnarly enough to work very precisely — not only for ‘mechanical’ bids, but for shorting at a potential top. The trendline noted above has been included. Here’s the new chart.
GCZ21 – December Gold (Last:1808.90)