
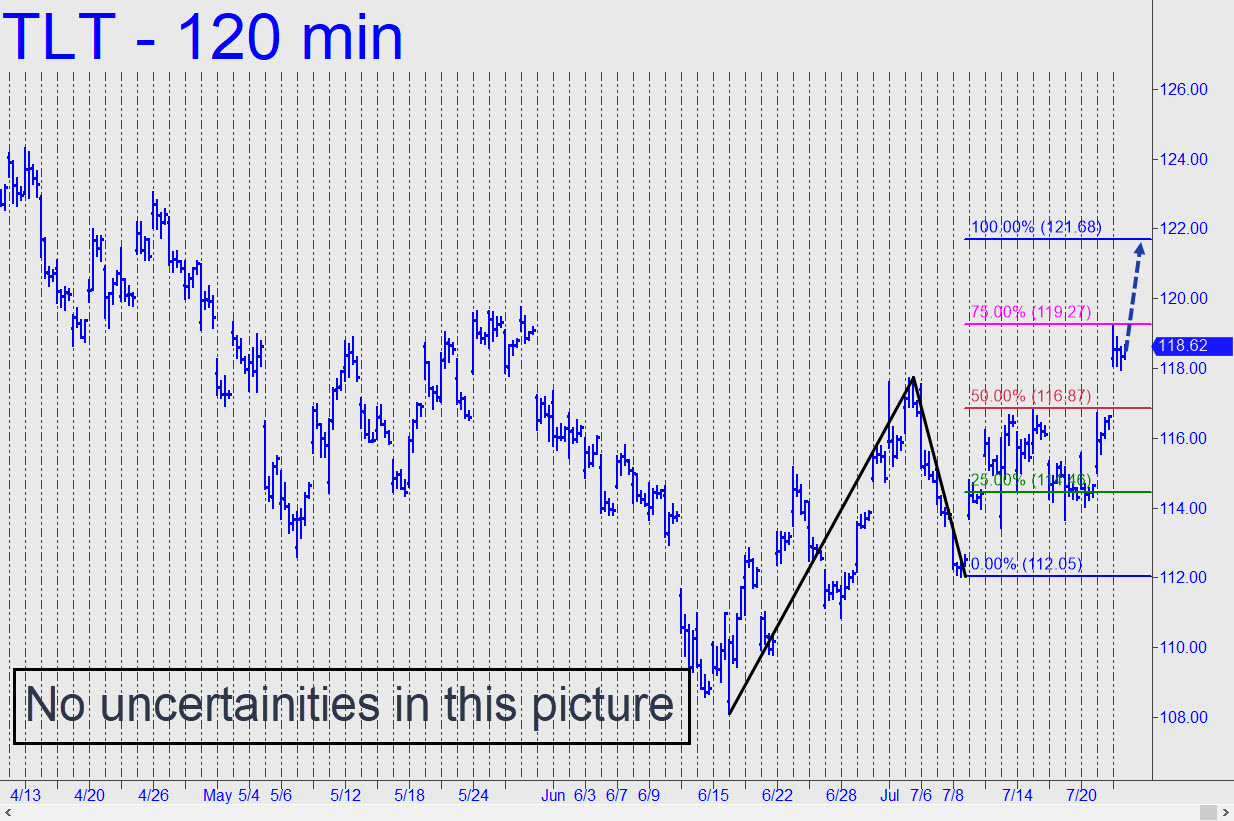
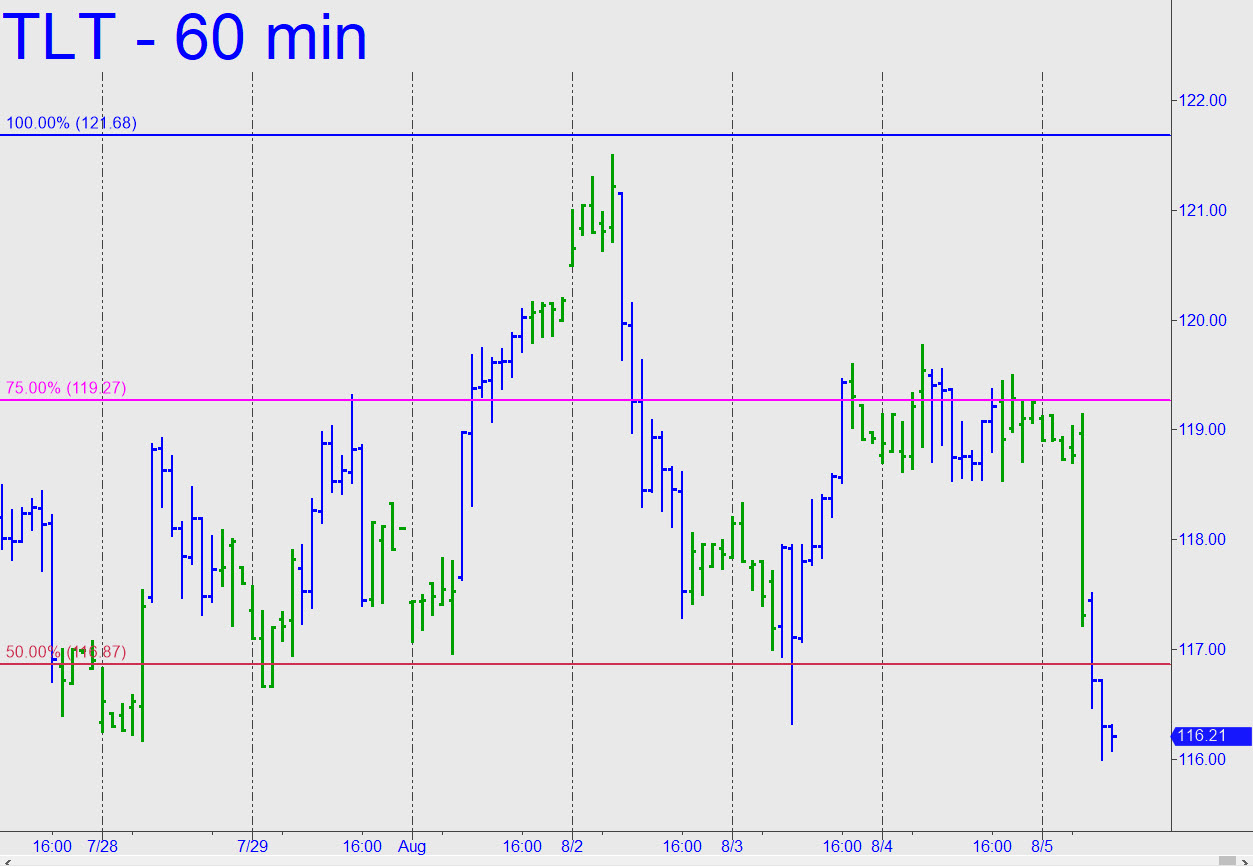
 TLT topped last week precisely at the D target of a pattern I’d shown on the 120-minute chart. The pullback was shallow, however, so I lowered the pattern’s point ‘A’ to produce a higher ‘D’ target at 121.68. This view affords me two predictions that I can make with very high confidence: 1) 121.68 will be reached, and 2) a tradeable pullback will occur from that price, give or take just a few pennies. Both predictions are based on price action at the midpoint Hidden Pivot resistance, 116.87. This rally will further affirm that the long bear market in Treasury paper is over and that interest rates on U.S. debt have peaked._______ UPDATE (Aug 5, 10:20 a.m. ET): TLT has pulled back sharply after an off-hours leap earlier in the week to 121.50, a tenth of a percentage point shy of the target I’d provided above. Perhaps price trends these days — in bonds, stocks, bullion and much else — get stopped cold at Hidden Pivot targets because the Fed has succeeded in confusing everyone, or at least getting everyone to obsess over Fed policy? This is quite a trick, considering that the very notion of using larger and larger quantities of debt stimulus to create ‘wealth’ and sustain the economy is a fraud. This is so because the economy to begin with and in notional dollars is based far more on paper shuffling than producing real goods and services. The deception arguably ranks as the greatest hoax every perpetrated on humanity,
TLT – Lehman Bond ETF (Last:118.62)
Posted on July 24, 2022, 5:24 pm EDT
Last Updated August 8, 2022, 11:39 pm EDT