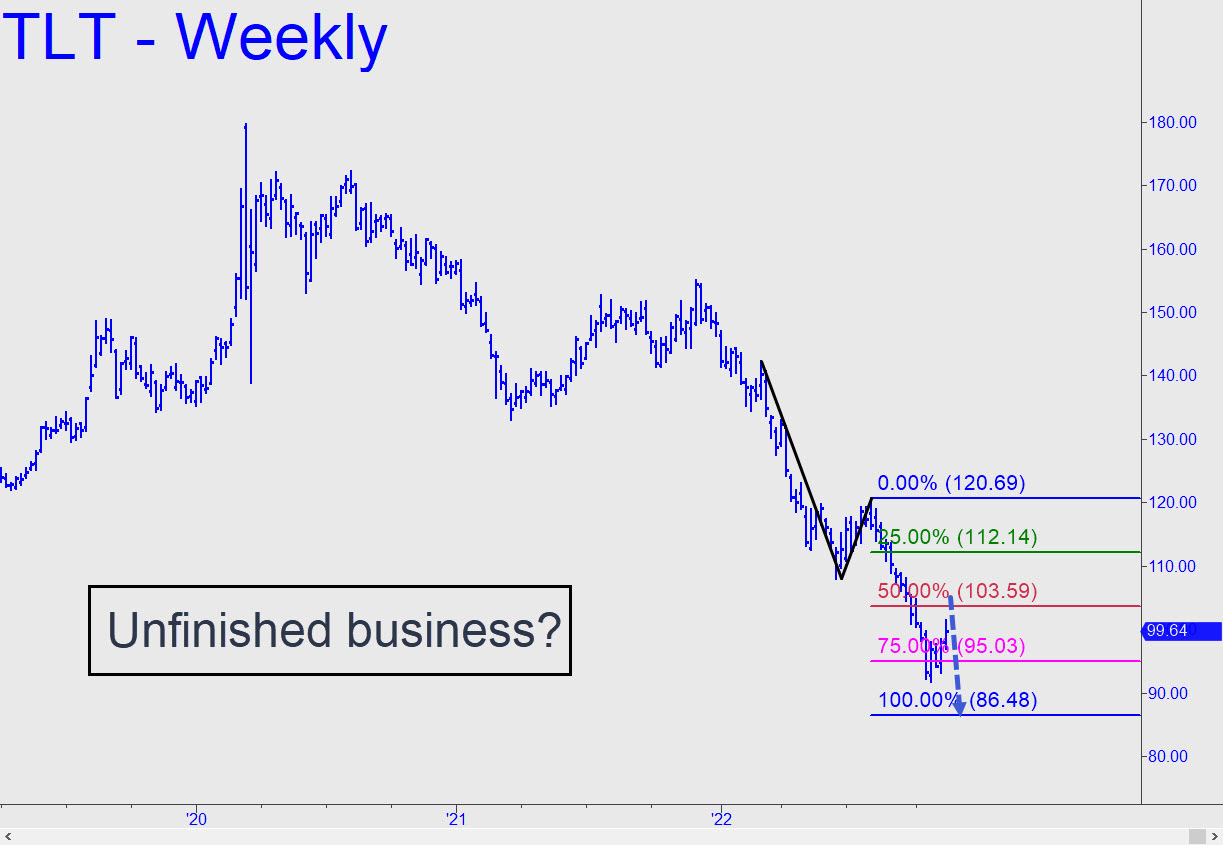
 A month’s ascent, some of it achieved with exuberant leaps, has generated the first impulse leg of daily-chart degree in a long time. This occurred last Wednesday when TLT poked above a small but technically significant peak at 100.90 recorded on Oct 11. Although the breach of the high warrants giving the bull the slight benefit of the doubt, I’ve displayed a weekly chart that shows the crag-less wall remaining to be scaled before the rally exceeds even a single peak in this time frame. I’ll be looking to bottom-fish nonetheless if sellers bring this vehicle down to within spitting distance of 97.09, last week’s low,
