
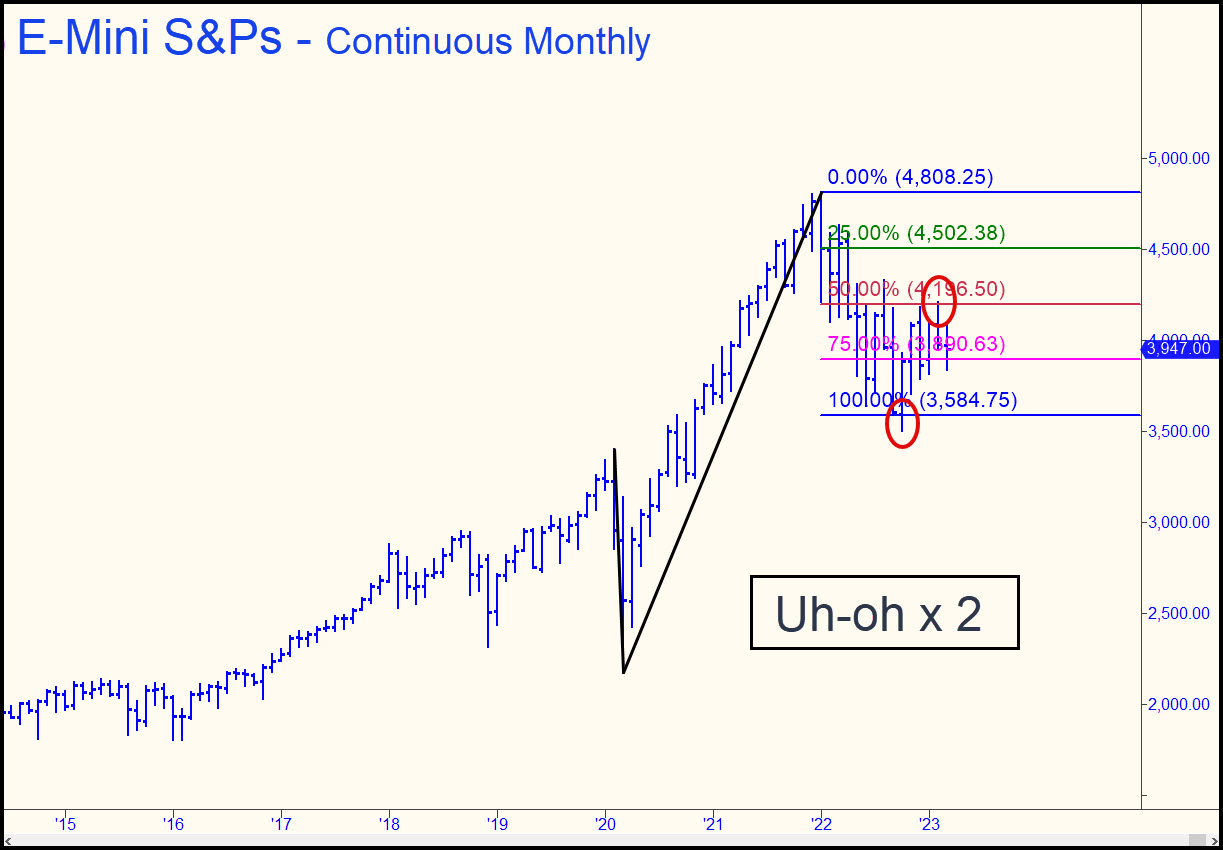
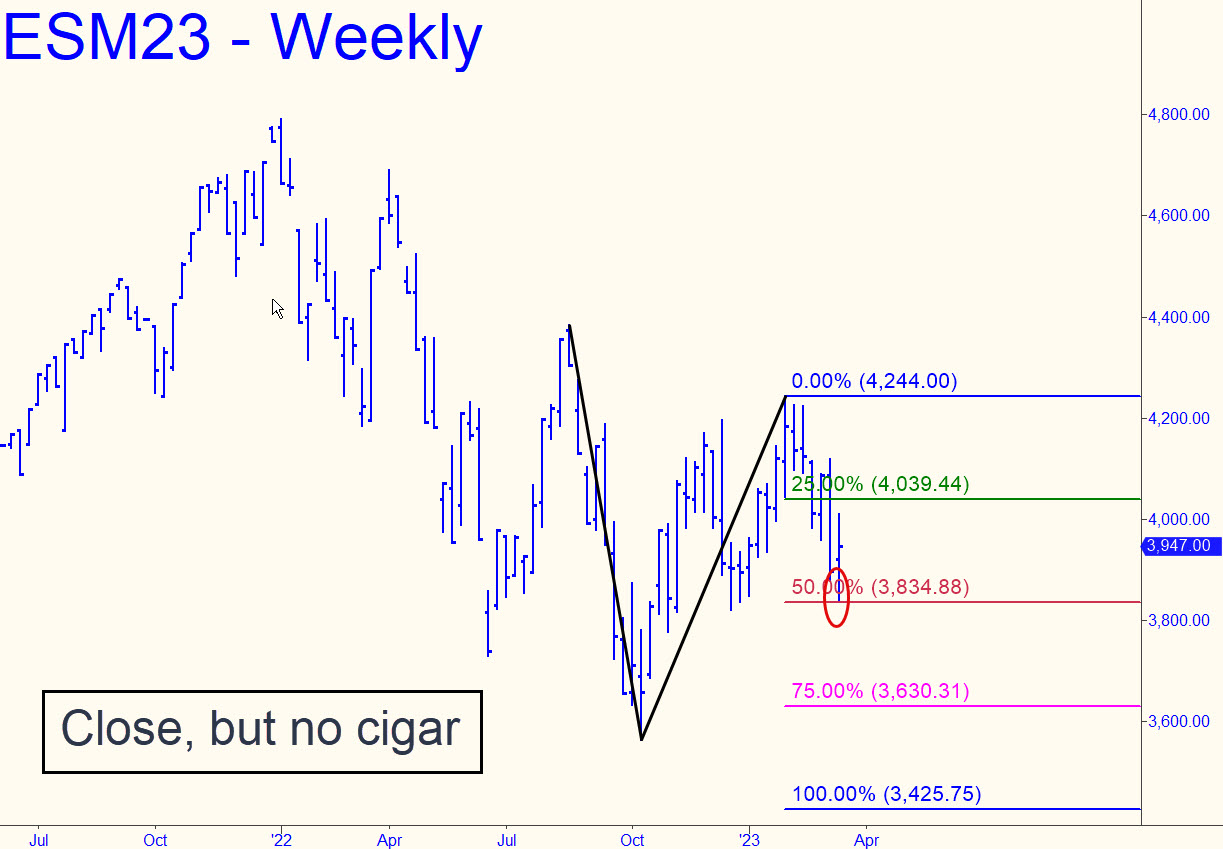
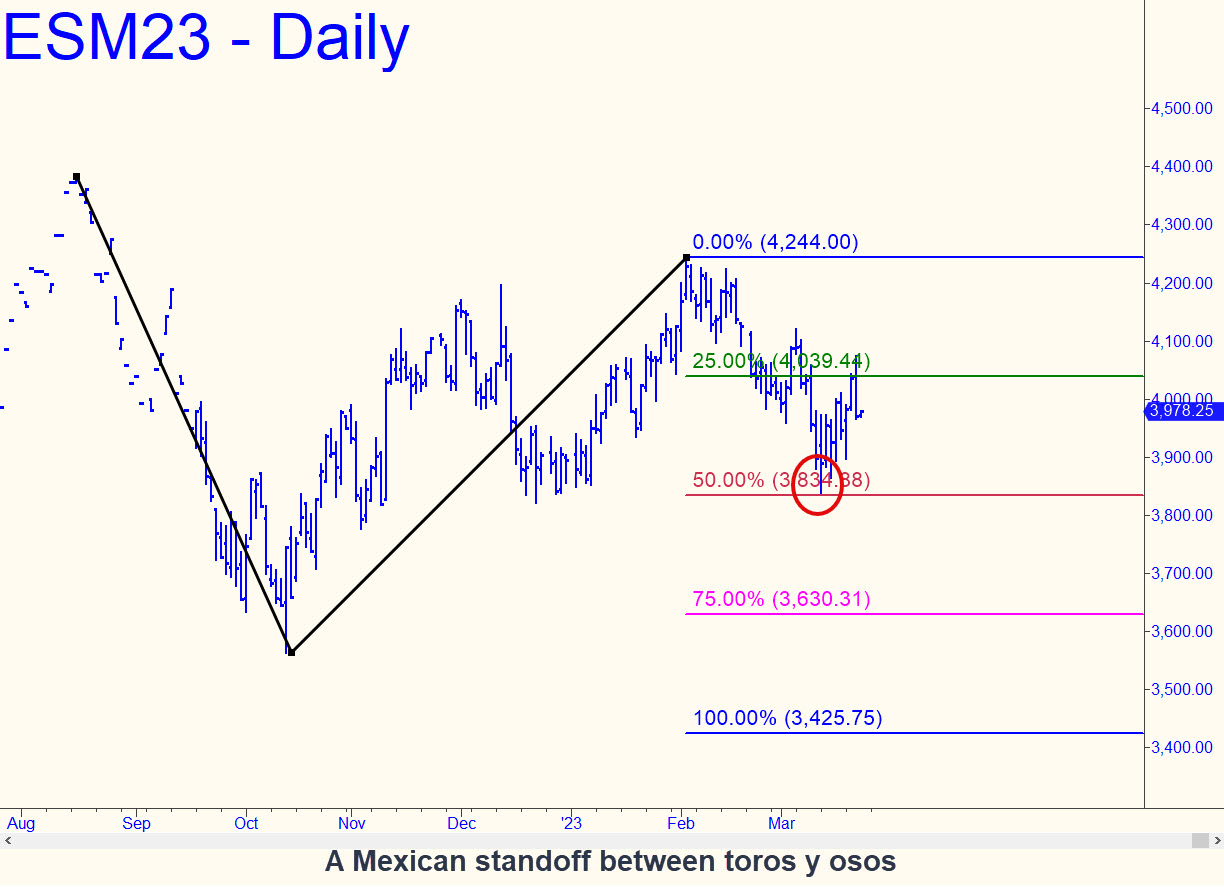
 On a long-term chart, the exceptionally clean reverse pattern shown reveals some mildly disturbing signs that we hadn’t detected before. First there was the dip beneath the pattern’s D target at 3584.75. The 80-point overshoot amounts to 2.2%, and although that may not seem like much, for a pattern this crisp, any breach exceeding even 1% should be viewed as moderately bearish. The stall on the rebound at p=4196 is not quite as compelling because the Hidden Pivot levels were already spent. However, the bounce from D appears to have lacked guts because it died well shy of the ‘external’ peak just to the left. All of these factors together do not necessarily spell collapse, but they argue for trading the S&Ps with a bearish bias. Here’s a weekly chart of the June contract that projects to as low as 3425.75 if sellers take out p=3834.88 decisively. The futures were a spec buy when they nearly touched the red line, but because the low missed it by five points, a run-up to the green line would not trigger a ‘mechanical’ short under a strict interpretation of our rules. I’ve offered a bigger picture than usual because smaller ones show an impacted mess that is best traded on sub-hourly charts. _______ UPDATE (Mar 22, 9:00 p.m. EDT): This afternoon’s universally expected outbreak of mental illness produced no significant changes in the technical picture. A Mexican standoff began on Feb 13 when the futures reversed from p=3824 of this presumptive bear-market pattern. This was a logical place for a trend, even a major one, to end, but we will continue to bide our time trading the swings until a clearer signal comes. Bears may be feeling burned out by now, but that is no reason for them to think the bear rally begun in October is ready to swing their way. The news will remain irrelevant for as long as we can imagine, since all news is being treated as good news. This is a cyclical oddity beyond human understanding, and there is nothing anyone can do about it.
ESM23 – Jun E-Mini S&P (Last:3976)
Posted on March 19, 2023, 5:20 pm EDT
Last Updated March 22, 2023, 9:00 pm EDT