
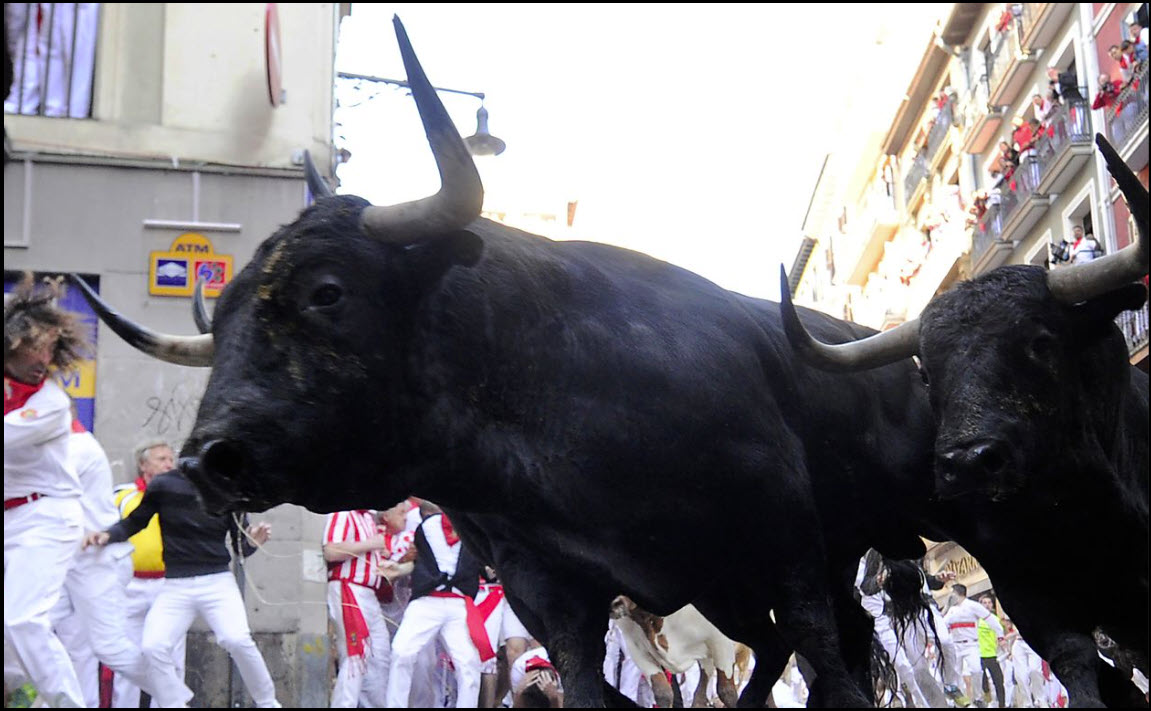
[Editor’s note: The following commentary draws parallels between today’s bond market environment and the last great bear market in bonds, which bottomed in 1981. It went out last month to clients of my friend Doug Behnfield, a financial advisor and senior vice president at Morgan Stanley Wealth Management in Boulder. Long-time followers of Rick’s Picks will be familiar with Doug’s unconventional thoughts on the markets, since they have been featured here many times before. I have always referred to him not only as the smartest investor I know, but one of the smartest guys. I am grateful to him for allowing me to share his insights with you. The charts are my own, since they reproduced better than the ones that accompanied Doug’s letter. Also, the photo of the annual Pamplona stampede is an emphatic touch of my own, since I share Doug’s very contrarian bullishness on Treasury debt. RA ]
Lately, I have been telling the story of my experience leading up to the all-time high in long-term Treasury bond rates that occurred in late 1981. I was kind of a rookie, having started at Merrill Lynch in late 1977 (at age 22). 30-year Treasury bond yields peaked at 15.25% in September 1981 and by then, 6-month CDs were paying 18.5% and the yield on the Merrill Lynch Ready Assets Trust money market fund was pushing 20%. Bond yields had rocketed from 10% to 15% over about 15 months so 30-year Treasury bond prices were down 35% compared to mid-1980. The reason rates got so high was attributable to steeply rising inflation and determined rate hikes by the Volcker Fed to put a stop to it. Back then CPI inflation had reached almost 14%. It was driven mostly by demand coming from an army of emerging Baby Boomers forming households and rocketing oil prices. Crude oil rose from $7.50 per barrel in 1975 to over $34 in 1981. Martha and I bought our first little bungalow in 1979 after being on our own for a couple of years.
As a stockbroker in Denver in 1981, my target market included wealthy oil company executives that were retiring and looking to invest their $600,000 IRA rollovers. (Back then, $600,000 was like millions). Anyway, “The Death of Equities” was a recent Business Week cover, appearing in August 1979, and stocks and bonds were both out of favor. They wanted “guaranteed” investments.
In the 2005 edition introduction of the Homer and Sylla classic A History of Interest Rates, here’s what the authors had to say about this period:
“The spectacular rise in interest rates during the 1970’s and early 1980’s pushed many long-term market rates on prime credits up to levels never before approached, much less reached, in modern history. A long view, provided by this history, shows that recent peak yields were far above the highest prime long-term rates reported in the United States since 1800, in England since 1700, or in Holland since 1600. In other words, since modern capital markets came into existence, there have never been such high long-term rates as we had all over the world a quarter century ago.”
Merrill Out Front
Paradoxically, Merrill Lynch Research declared “The Dawn of the New Bull Market in Bonds” in a full page add in The Wall Street Journal in June of 1981.
“In 1981, Richard J. Hoffman, then chief investment strategist for Merrill Lynch & Co., forecast what he called “The Dawn of the New Bull Market.” At the time, his outlook for steep interest rate declines and the favorable environment that would be created for fixed-income securities seemed almost ludicrous. Double-digit interest rates had reached 15 1/4% then and were expected to climb even higher.”
Pounding the table for long-term bonds was perhaps the best call the firm ever made. But imagine the conversation with clients. “Mr. Amoco executive, rather than buying a six-month CD at 18.5%, I think you should tie your money up for 30 years at 15% in an instrument that is down 35% in value in the last 15 months”. People in the investment profession during that period could not be blamed for thinking that the brilliant screenwriter of the “Yellowstone” television series, Taylor Sheridan, should consider writing a show about this. “1981: Selling Retirees on Making an Investment in Bonds at the All-Time Lows”.
Anyway, $600,000 invested in 30-year Treasuries at 15% would have provided $90,000 for life in risk-free, non-callable interest income. In the six-month CD at 18.5%, the number was $111,000, but after six months, who knows? What actually happened was that five years later, six-month CDs were yielding 5% (on their way eventually to below 1%) and the 30-year Treasury Bond was trading at a yield of 7.53%. If they chose the CD, their $600,000 was still $600,000, but their income was now $30,000. If they picked door number two by some remarkable act of salesmanship, they were still collecting $90,000 per year in income, but their account had also appreciated by about 89% to over $1.13 million, because bond prices appreciate when rates decline. The drop in rates was attributed to a recession that reduced demand, so inflation dropped, and the Volcker Fed cut rates dramatically to stimulate economic activity.
The moral of this story is that there is no such thing as a non-decision when it comes to picking your maturity. What was popularly understood to be a no-brainer in 1981 (the CD) turned out to be a “wrong” investment decision. At the all-time bottom in price (peak in yield) for long-term Treasury bonds in 1981, the popular belief was that inflation was headed to 20% and rates had nowhere to go but up. Human nature makes stepping back and considering the cyclicality of markets tremendously difficult at extremes. That, in turn, leads to linear thinking just when the cycle is reversing. Today, cash at 4%-5% is very popular. Why tie up your money for 30 years in a Treasury bond at 3.65% (at the peak last October, they were 4.4%)? It is a very good question.
2022: The Worst Year for Bonds in Memory and The Dawn of a New Bull Market in Bonds
The recession that could have begun a year ago may have waited until now when the Fed precipitated an “accident”. Jeremy Grantham mentioned something in conversation right after the failure of regional banks that I thought created a wonderful visual:
“When you are looking up at the dam, you can never tell which brick will be the first to pop.”
Since the banking crisis began last month, the expectation for a “pause” on the part of the Fed and the likelihood of rate cuts later this year have replaced “higher for longer”. Mike Wilson, Morgan Stanley’s Chief Investment Strategist, points out in a recent comment that the “credit crunch” associated with the banking crisis will have an extremely negative impact on the economy and corporate earnings. But before that brick popped, the Index of Leading Indicators and the shape of the yield curve were already suggesting a recession. A credit crunch will just make it worse if it occurs.
Business Cycle
Historically, it is the recessionary part of the business cycle that includes declining inflation and Fed easing. That causes the yield on bonds to drop and the price to rise. In the current cycle, inflation peaked at 9.1% last June and at the most current reading (March) it has dropped to 5.1% on a trailing 12-month basis. Subsequently, 30-year Treasury bond rates peaked in late October at 4.425% and have come down in irregular fashion to 3.65%. The magnitude of the recovery in bond prices will depend largely on how severe the recession is.
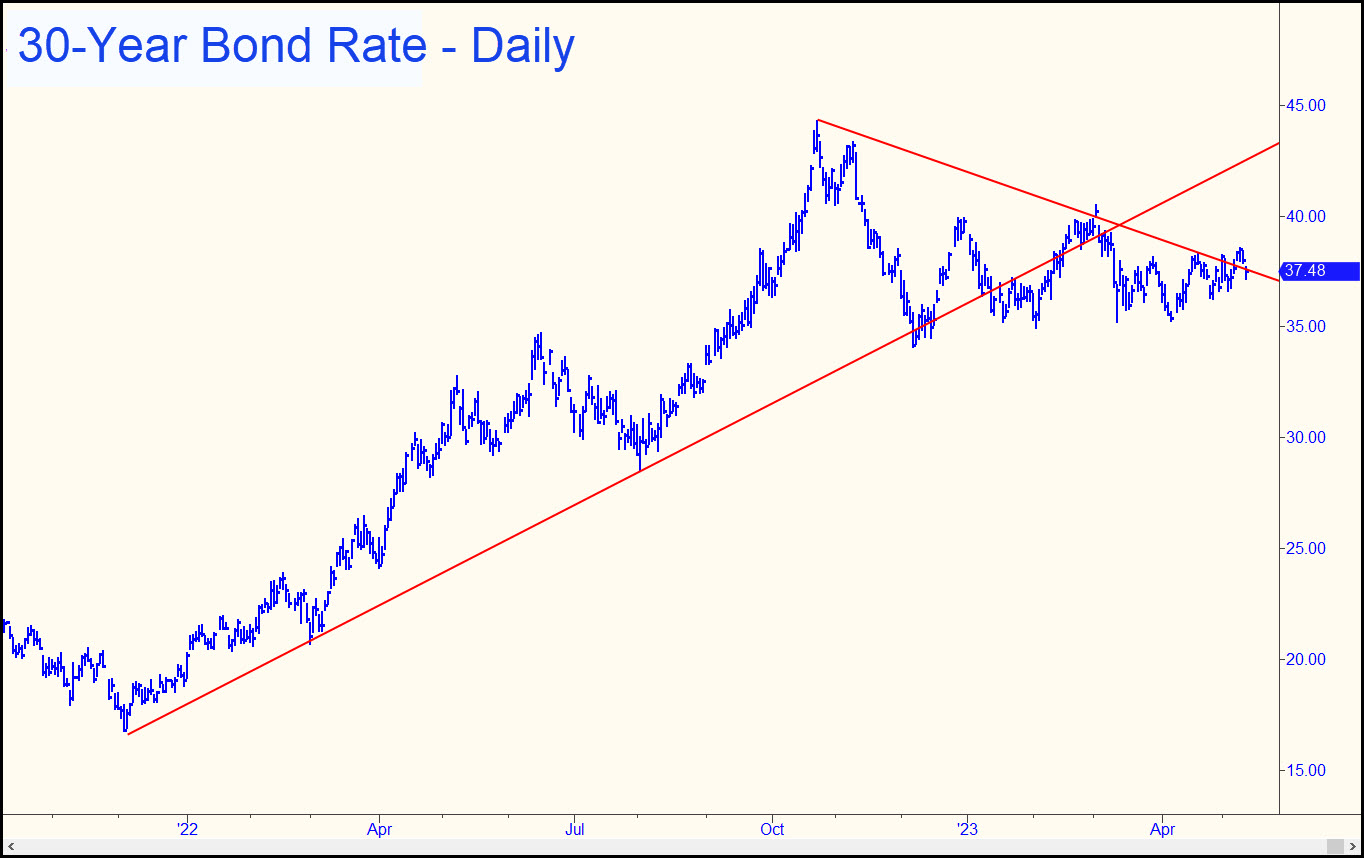 .In the chart above, the increase in yield from December 2021 to the peak in late October 2022 was 2.75% (1.678% to 4.425%). The price of the 1.875% Treasury bond due November 15, 2051, declined from 104.69 in December 2021 to 58.625 in October 2022. This was a price decline of 44%. Today, that same bond trades at 68.25 to yield 3.68%. Therefore, a hypothetical “round-trip” return to a 2021 level of 1.7% would result in a price of 103.95 and an appreciation of 52% from here (and 77% off the low last October). A decline of that magnitude would require a dramatic decline in inflation and in the Fed Funds rate. In 2021, inflation began the year at 1.7% after hovering between 0% and 2% in 2020. Fed Funds were set at 0.25% throughout 2021 and into 2022. Regardless, from a risk/reward perspective, recessionary periods have historically resulted in superior returns for bonds compared to most other investment categories
Since the failure of several mid-sized banks due to a deposit run early last month, expectations for Fed policy have changed dramatically. Prior to this banking crisis, market expectations were that the Fed would hike rates several more times and not start lowering them until sometime next year. This view was supported by Fed guidance and strong economic data from January that previously supported the argument for a “soft landing”, i.e., no recession. In addition, the stock market was recovering from year-end 2022 into early February of this year.
However, since the bank failures in early March, markets have priced in an end to Fed hikes next month and rate cuts beginning in the second half of this year.
Long-term bond rates have declined, and stocks have rallied back a bit on the prospect of a more accommodative Fed, but Mike Wilson continues to forecast a dramatic decline in stocks over the next few months. Based on current market valuations and the likelihood of a profits recession that will result in very disappointing corporate earnings, he anticipates a decline in the S&P 500 to approximately 3000, from a current level of 4100. In the meantime, extreme stress in the commercial real estate market and the impact that it will have on credit conditions for bank lending is of further concern, as expressed by Lisa Shalett, our Chief Investment Officer.
Great Financial Crisis
“While totally different from the credit problems of the 2008 Great Financial Crisis, it features knock-on effects that are apt to be detrimental to economic growth, employment, and corporate profits. With the odds of recession now rising as bank lending tightens, we view optimistic forecasts priced into stock markets as even more at risk.”
In summary, deflationary forces in the economy have been exacerbated by aggressive Fed rate hikes and the magnitude of the ensuing economic contraction will be revealed over time. Problems in the banking system have all the earmarks of the type of “accident” that has often reversed the interest rate cycle from up to down. Historically, rates and inflation only find a bottom once a recession has run its course and the Fed has completed an easing cycle. That will most likely mark the peak in the recovery of long-term Treasury bond prices.
To conclude on a personal note, I always run my Quarterly Commentaries by some of my closest associates for input, and David Rosenberg emphasized the historical perspective of this one. The remarkable decline in bond prices in the year ending in October of last year is an example of historically significant market events. We discussed how difficult it is to offer investment advice, particularly when times are fraught with risk. It is those times when the importance of preservation of capital meets head-on with investment opportunity. A historical perspective becomes indispensable. Investment strategy decisions are never more challenging than times like these. David offered me several of his favorite quotes on historical perspective: Confucius: “Study the past and you define the future.” Rudyard Kipling: “If history were taught in the form of stories, it would never be forgotten.” Winston S. Churchill: “The farther backward you can look, the farther forward you are likely to see.”
****
AI’s Bland Stupidity Guarantees Its Success
Here’s a link to my recent interview with Howe Street’s Jim Goddard. We talked about the very promising future for AI chat bots, because they are as dumb and unimaginative as the legal boilerplate they will soon be churning out. So long, lawyers! We won’t miss you. Jim and I also discussed the stock market’s absurd, impossible, heedless, climb, which I expect to continue.
Hi Rick and Company
Always enjoy your and Doug’s commentary, particularly since attended Merrill in San Francisco Bay Area from 1976 to 1986 with Oxford Blues sabbatical.
1981 and later clients who jumped aboard what Gary Schilling, another Merrill Alum, called one of the greatest bull markets of the century, tended to be financial people like CFO’s and Comptrollers who understood the math.
With much respect, where we part ways with repeat calls for a resumption of the Bond Bull Market, is that two reliable indicators, Big4 and PnF, still say No, Heck No.
Big4 is 175 % Short the largest Long Bond Futures market. Phantom income taxed EDV has a target of – 51.5 % from 88.5 to 43.74 – 3.15 % with Normal Risk to 91.16.
No doubt ABCD point pivots can and will further define and refine things for profitable results with preservation of capital.
While the Bible, Churchill, Confucius, Grantham, Kipling, Rosenberg and Wilson make compelling reading, there is a compelling qualifier to History Repeats or at least Echoes.
Namely, all bets are off when nominal rates and returns hide real value.
The rest of the story here may be that there are a mighty budget currency catapault engines in DC that hide Babylon Keynesian Money Magic Theft from The Once Thundering Herd.
Namely, real rates of inflation measured in 1980 CPI metrics approach 13 %. Yields below 13 % do not preserve, but actually confiscate capital. Then there are taxes for ordinary mortals that further reduce returns.
Accordingly we have been accumulating NEM, already down -35 % in under a year to a value with 3.48 % Dividends , comparable to EDV with currency protection. During the last Great Depression, a leading gold company outdid all other comers with appreciation and dividends, funding the Hearst empire.
No guarantees similar will happen with a Confiscatory Greatest Depression.
Yet NEM’s PnF target is + 126 % from 45.46 to 102.6 + a 3.48 % Dividend with growing earnings, currently trading at the 2 standard deviation lower Bollinger Band.
Cheers all RA.