
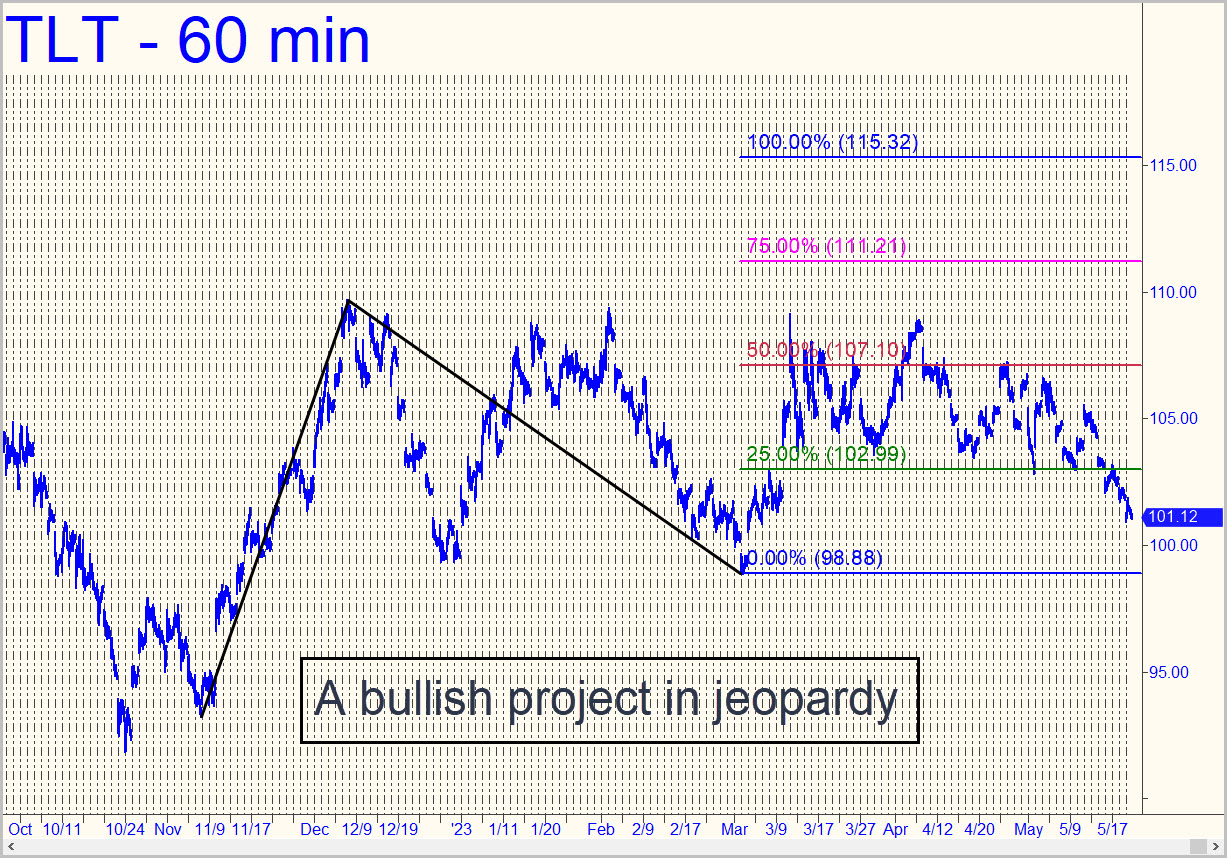
 The rally target at 115.32 has been on the marquee for so long that I’d taken a relaxed view of its likelihood of being achieved. However, last week’s ratcheting fall threatened to kill the bullish project with a dip beneath the ‘c’ low at 98.88 that would invalidate the rally pattern. The chart would still be bullish overall, but more tenuously so, since structural support from lows recorded last November near 92 would beckon a test. In the meantime, expect TLT to continue working its way down to 98.88, if only to further discourage the few bond bulls out there. ______ UPDATE (May 31, 8:15 p.m.): The way this vehicle nitwits around, you could almost lose sight of the fact that it represents one of the deepest, most liquid markets on the planet — and also one of the most important. One could draw a parallel to Joe Biden, a hair-sniffing, thieving, demented old coot occupying what was formerly the most important leadership position in the world. Ahh, for the good old days!
TLT – Lehman Bond ETF (Last:102.79)
Posted on May 21, 2023, 5:16 pm EDT
Last Updated May 31, 2023, 8:19 pm EDT