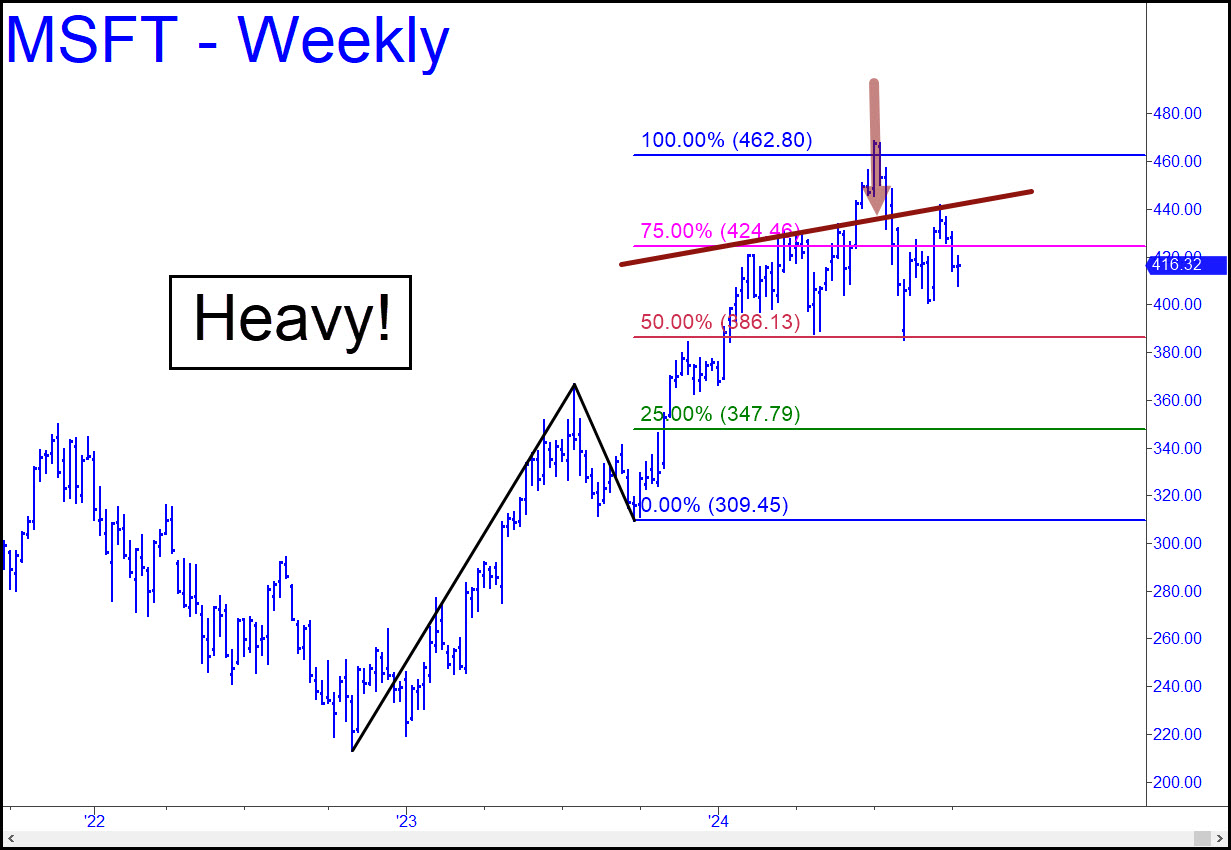
I’ve led the list this week with our #1 bellwether, MSFT, because it may have more to tell us about the bull’s condition than the E-Mini-S&Ps. They topped last week a tick from the 5868.50 rally target I’d sent out to you a week earlier, theoretically maxing out upside potential for the time being. MSFT, on the other hand, may already have topped. It has been struggling mightily against the weight of an incipient head-and-shoulder pattern that could eventually mark the top of the bull market and take the stock down 100 points. Neither chart is conclusive by itself, but taken together they argue for strong caution. In addition, MSFT never quite reached the drum-rolled 449.54 target of a lesser but still important pattern, shortening the odds that a major top is in. We’ll be better able to judge once we’ve seen the downtrend play off the 400.47 midpoint support of this pattern, which began with an authentic, bearish impulse leg that exceeded a major external low (April 25’s 388.03). Use this number as a minimum downside projection for now, and expect MSFT to drag the stock market lower. ______ UPDATE (October 18, 9:33 a.m.): A chat room denizen asked for a more granular picture, and I replied as follows: “[The stock is] a tough call, since minor ABCDs in BOTH directions have been achieving their D targets. This suggests bulls and bears are stalemated for the time being. I hate letting a head-and-shoulders pattern decide it for me, but the one linked here looks prettier by the week. Even so, a pullback to the green line (x=405.38) would trigger a promising ‘mechanical’ buy.
MSFT – Microsoft (Last:416.32)