
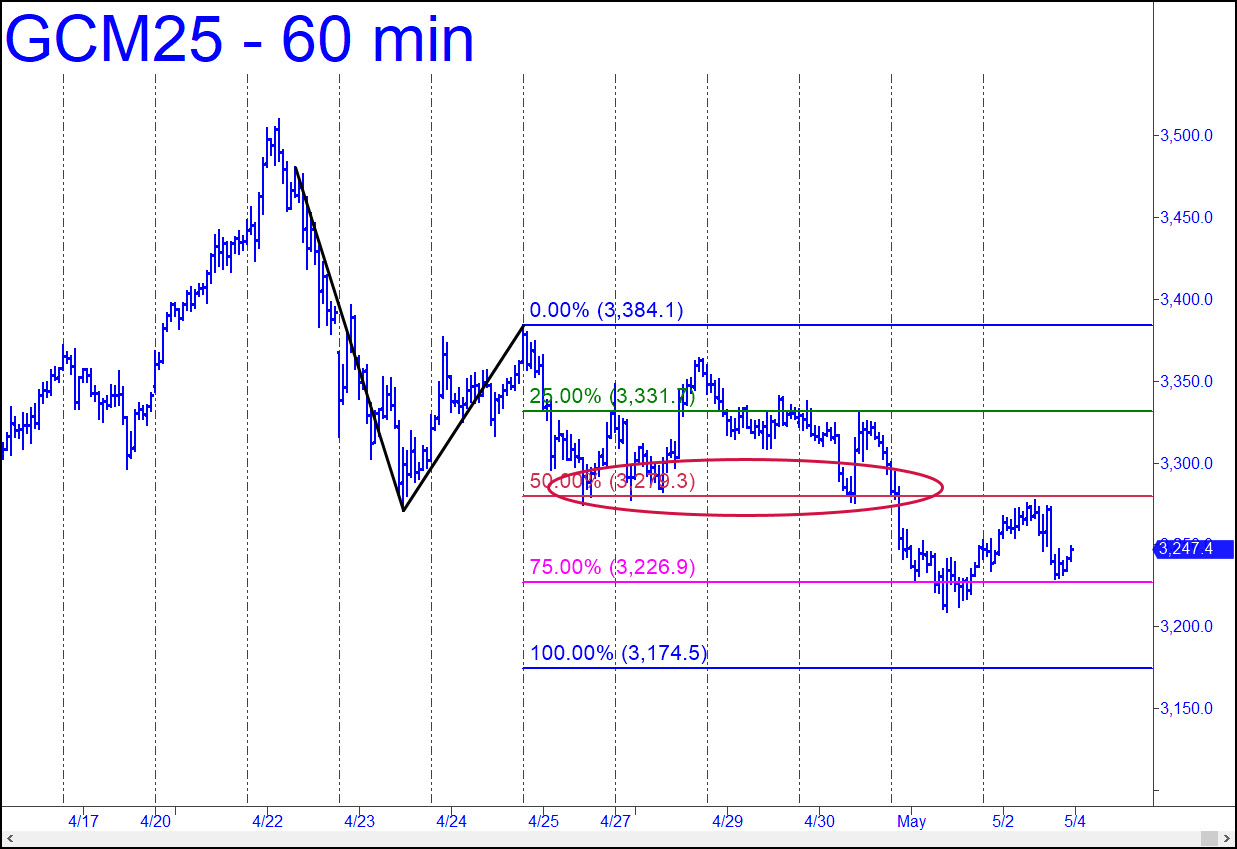
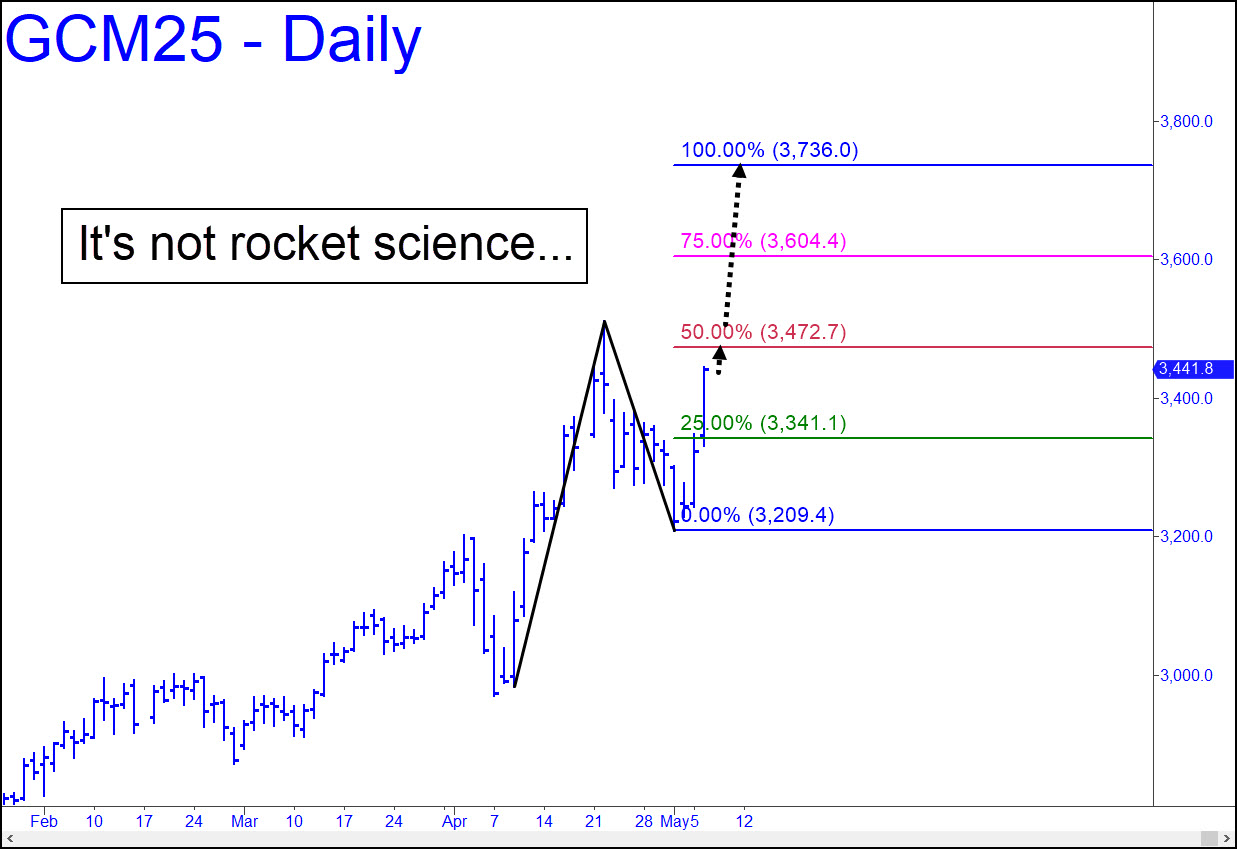
 I used a tiny one-off high to draw the pattern shown, but three confirmations at p suggest it will produce only winning outcomes for us. That would imply that a drop to D=3174.50 should be bought aggressively, albeit with the obligatory micro-stop possible using a ‘camo’ trigger. One thing the chart does NOT say is that June Gold will necessarily reach the target, since the initial penetration of the midpoint Hidden Pivot was anything but decisive. Notice, however, that it delivered a profitable ‘mechanical’ short – three of them, actually – and that’s usually a tip-off that D/d will be reached. We don’t much trade ‘conventional’ patterns any longer, but this one, with its crazy point ‘a’ and asymmetry, seemed ripe for exploitation. _______ UPDATE Apr 6, 5:52 p.m.): As the chart makes crystal-clear, June Gold is headed most immediately to 3472.7, the ‘midpoint Hidden Pivot’ of the pattern shown. It can be shorted there, but only with a delicate stop-loss, since the futures will be on their way to 3736.00 in a trice if they blow past the midpoint resistance without hesitation. You could always try shorting up there, but wouldn’t it be far better to shove your accursed doubts aside for once and catch an almost certain 300-point rally?