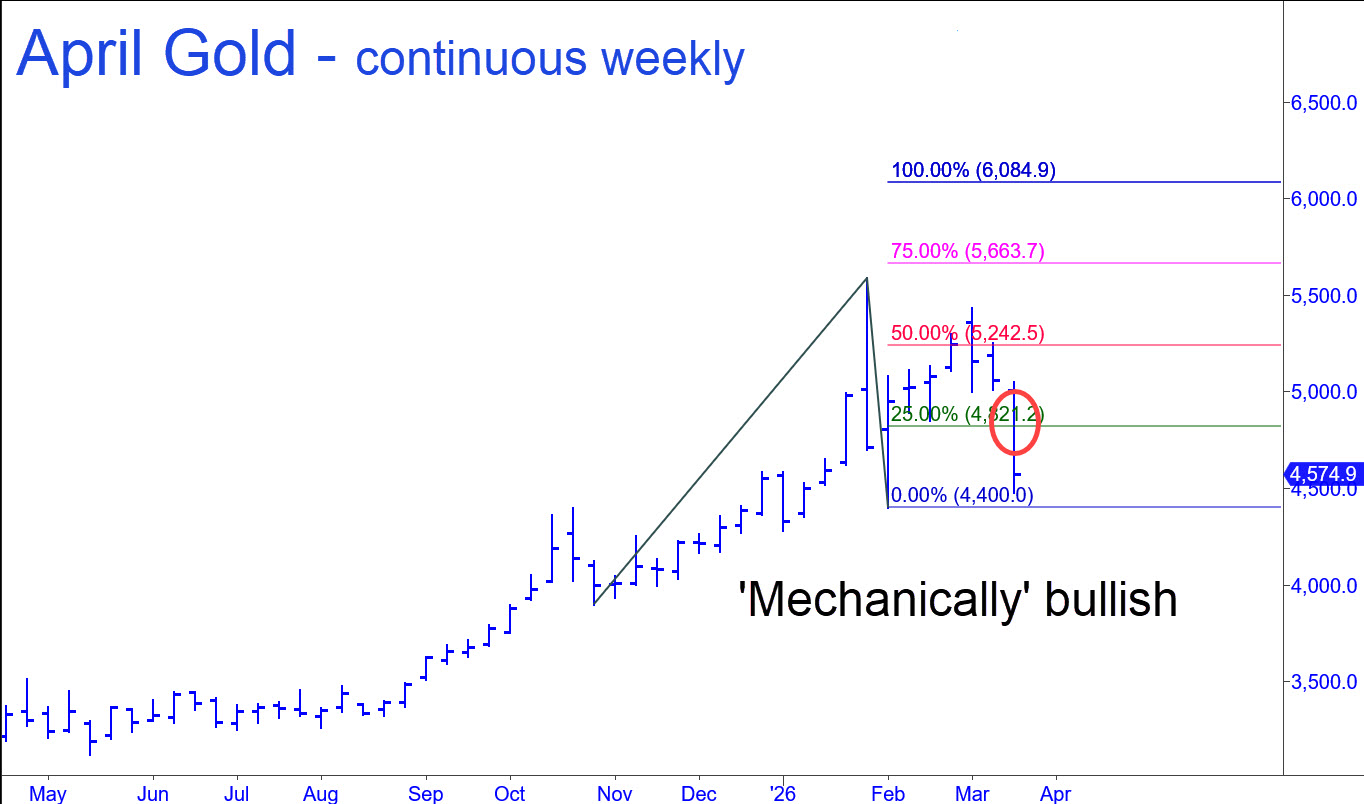
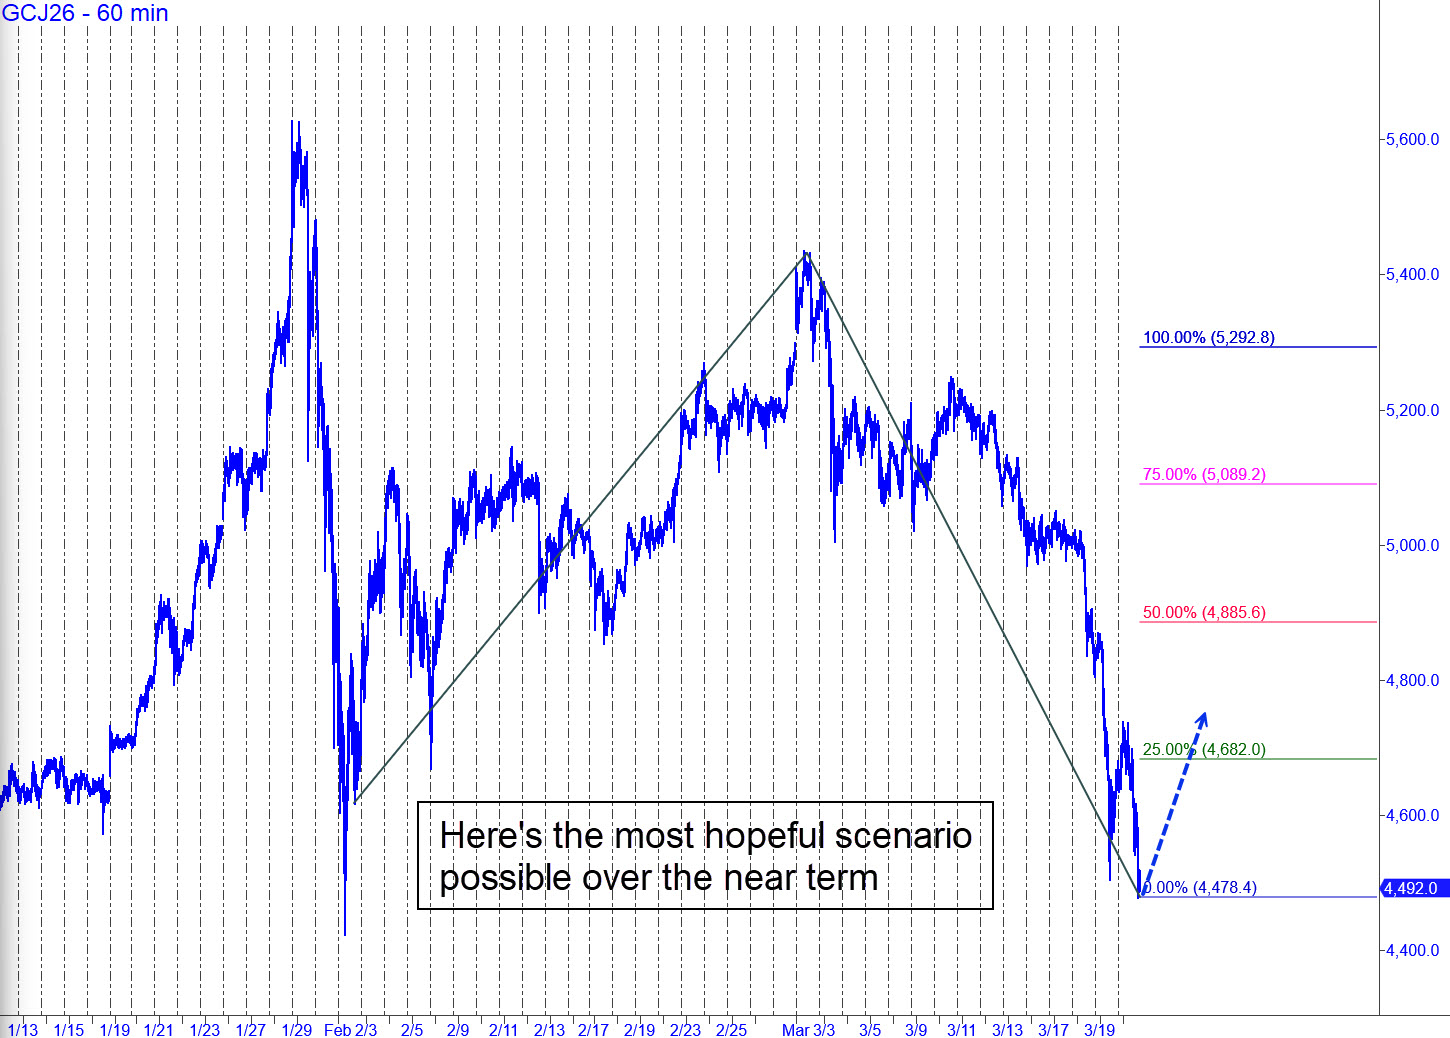
 A conventional pattern dating back to February’s record highs near 5600 implies the April contract will continue falling to at least 4378.70 before it can find good traction. This seems more likely at present than a reversal off Friday’s low, which narrowly spared a big, bullish pattern that traces back to January and yields a 5732 target. I am featuring a bullish rABC pattern nonetheless so that you will be able to see it develop in real time if gold’s correction is already over. My gut feeling is that the geopolitical world is sufficiently treacherous to support a bull market in bullion for the foreseeable future, even with the dollar and interest rates rising. If correct, this implies the vicious shakeout in bullion is already egregiously overdone. I’ll leave you with the most bullish interpretation possible at the moment, a continuous weekly chart that shows April Gold to have triggered a promising mechanical ‘buy’ signal last week at the green line (x=4821). It is predicated on a D target at 6084.90 and requires a 4399 stop-loss. _______ UPDATE (9:19 p.m.): This afternoon’s opening rip stopped out all short-term bulls. Voodoo 4273.40 looks like the next potentially tradeable bottom on a relapse, but that doesn’t mean you, Nick. _______ UPDATE (March 25, 6:45 p.m.): Bulls will be on their way to 5110.90 if they can impale the 4605.50 midpoint resistance that neatly contained their progress today. Use the 60-minute chart and a=4423.20 on February 2 to draw the target pattern and tradeable levels. A pullback to 4352.70 would trigger a salacious ‘mechanical’ buy, stop 4,099.00.
GCJ26 – April Gold (Last:4527.90)