
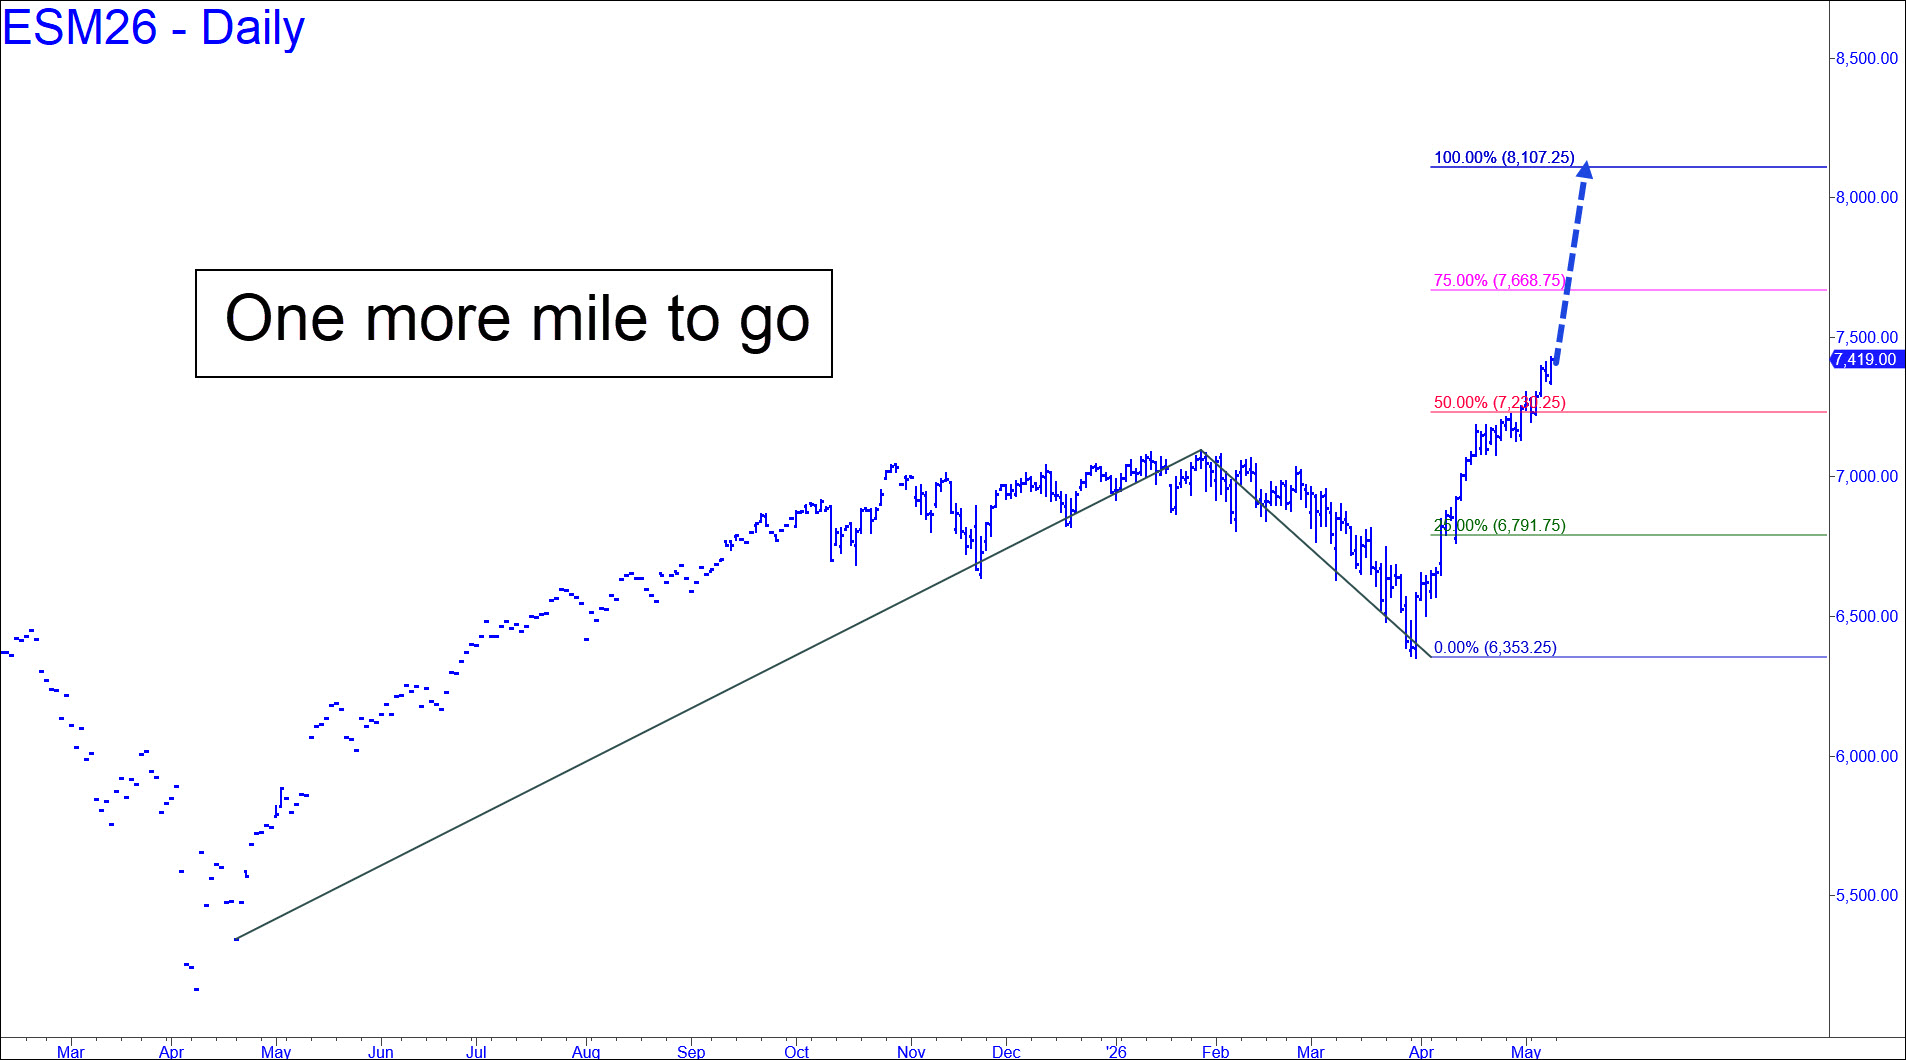
 This chart, with an 8107.25 target, has the virtue of simplicity: it follows all my rules, and that is reason to expect it to work. I’ve mentioned a couple of lesser targets based on somewhat different coordinates, but, as the song reminds us, it’s never good to mess around with mister in-between. The main subjective concern is whether last week’s move past the midpoint Hidden Pivot (p=7230,25) was sufficiently effortless to ensure the target, a 23% jump from here, will be reached. Because buyers did not exactly impale the resistance, I cannot guarantee that this will happen. But I am about 75% certain of it, and 95% sure that p2=7668.75 will be achieved. In the meantime, although a relapse to the green line (x=6791.75) would be read by many technicians as the possible start of a bear market, it would signal a stellar buying opportunity from a Hidden Pivot standpoint. I will mention one other number that could be consequential: 7499.75, the ‘D’ target of a conventional pattern. But because it comes from a composite monthly chart, we shouldn’t expect it to work quite as precisely as a Hidden Pivot resistance on a chart where all four coordinates are tied to the June contract. _____ UPDATE (May 12, 3:56p.m.): A coincident target at 7498.00 drawn from the hourly chart needs to be considered as well. It is the ‘D’ Hidden Pivot of a pattern that began on April 12 with A= 6767.00 on the hourly chart. This is yet one more reason to get short in some fashion when, either Wednesday or Thursday, ES sleazes its way up to 7500, a very round number that is bound to draw a crowd of clowns, algos and short-covering ninnies.
ESM26 – June E-Mini S&P (Last:7429.50)