
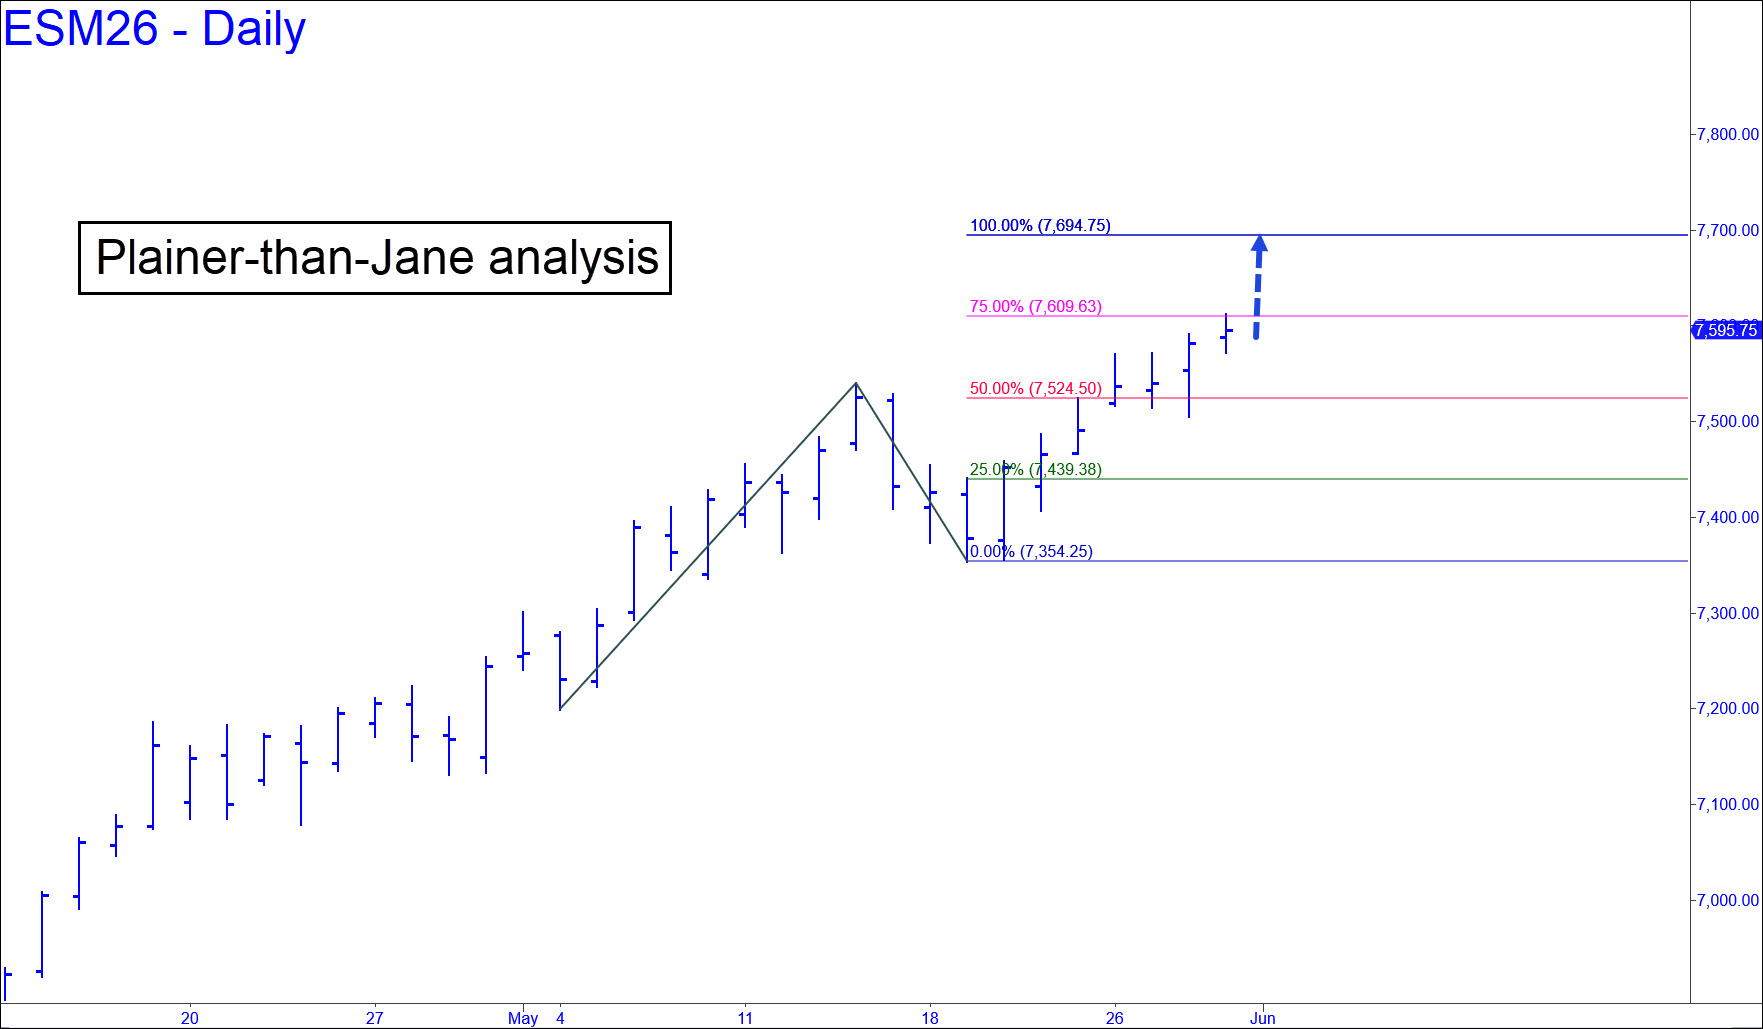
 Who needs sophisticated analysis when the broad averages rise or go sideways 95% of the time, and when they never fall for more than three consecutive days? The chart assumes the E-Mini S&Ps will continue their ascent next week, possibly stopping for a short breather when they hit 7694.25, the ‘D’ target of the conventional pattern shown. The coordinates are probably too obvious to produce a precise top at that price, a Hidden Pivot, but I would still encourage you to try shorting there provided you know how to set up a ‘camo’ trigger to minimize entry risk. The goal is to make money even if the futures keep rallying, although that might entail being short only for a fraction of an hour. If we continue to short this gas-bag routinely at minor rally targets, one of these days we might actually find ourselves onboard for The Big One — and what great fun that will be!
ESM26 – June E-Mini S&P (Last:7595.75)