
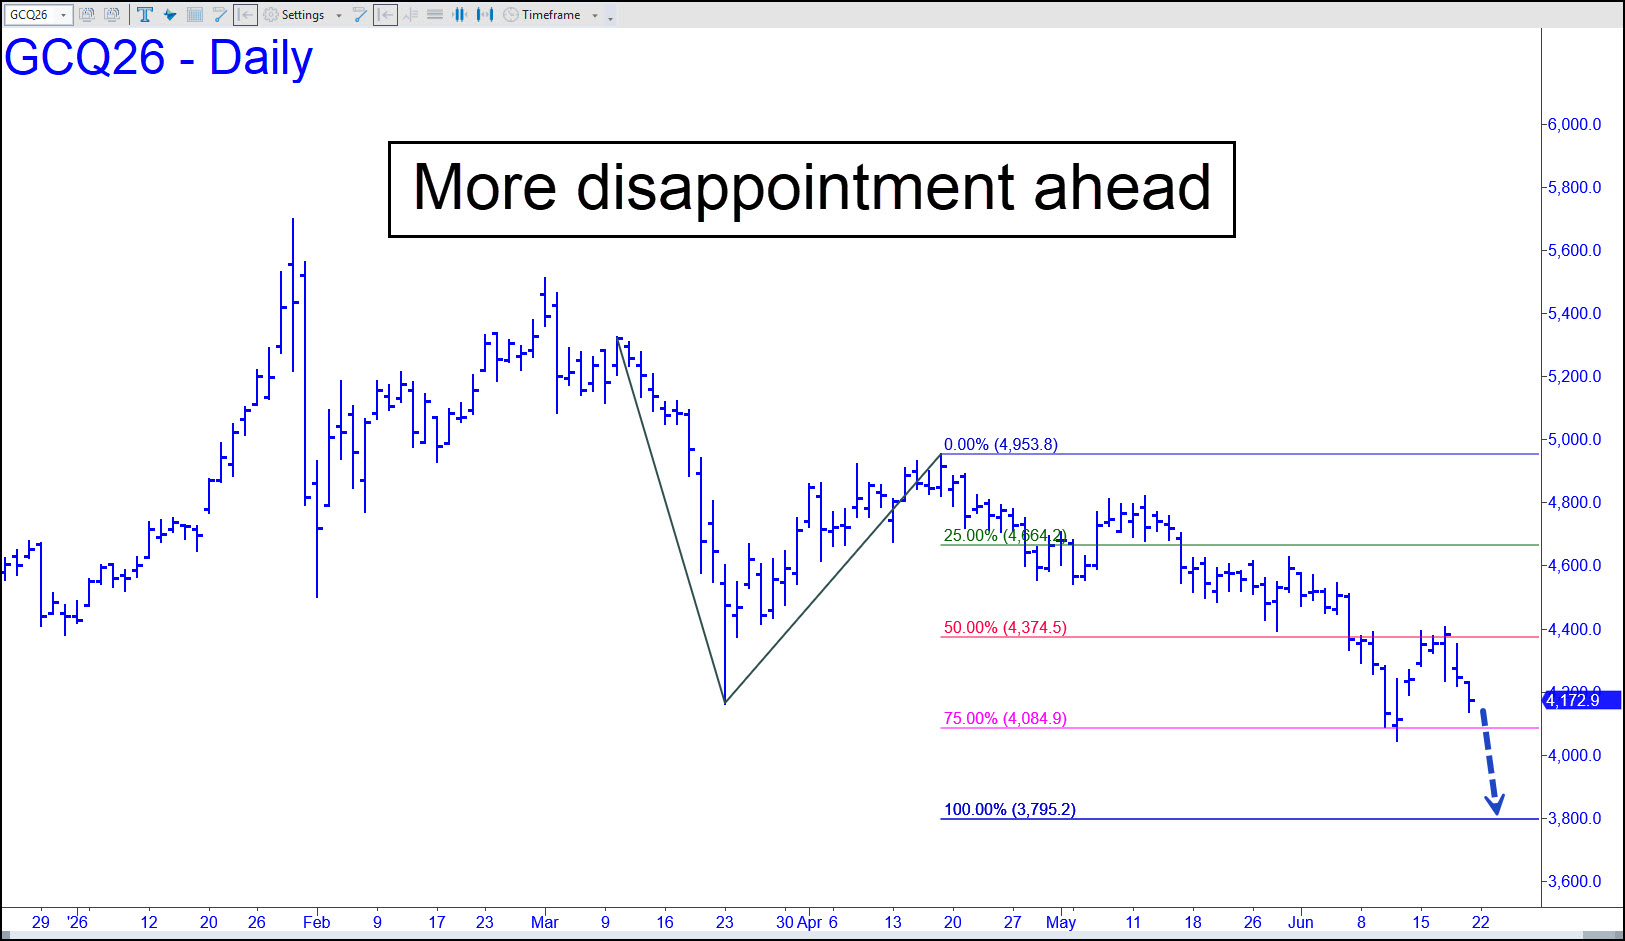
 Brace for more disappointment in the days and weeks ahead, since the futures give every indication that they’ll continue falling to at least 3795.20, the ‘D’ target of the pattern shown. Gold will have given up a third of its peak value if that happens, a middling bear market. A rally in the meantime to as high as the green line (x=4664) would be widely interpreted as bullish, but Hidden Pivot analysis suggests it would actually set up an opportune short sale. If you’re eager for signs of a durable upturn, look for a rally that exceeds two prior peaks on the daily chart without a B-C correction. Another indicator would be corrective patterns, including those in minor-degree charts, that do not reach their D targets but instead reverse from the midpoint of Hidden Pivots. _______ UPDATE (Jun 24, 9:11 a.m.): If you are looking for a reliable way to determine when this plummeting cinder block may be turning higher for good, use TI=197.80 (a=4162 on 3/23). It already flashed one false signal with a rally that failed to reach then-p (4441.80), but I am betting that Mr Market cannot repeat this nasty trick. More immediately, if GCQ 26 can’t get traction at p2=3967.90, it will continue lower to D=3822.7o (daily chart, A=4627 on 5/29)
GCQ26 – August Gold (Last:3992)