
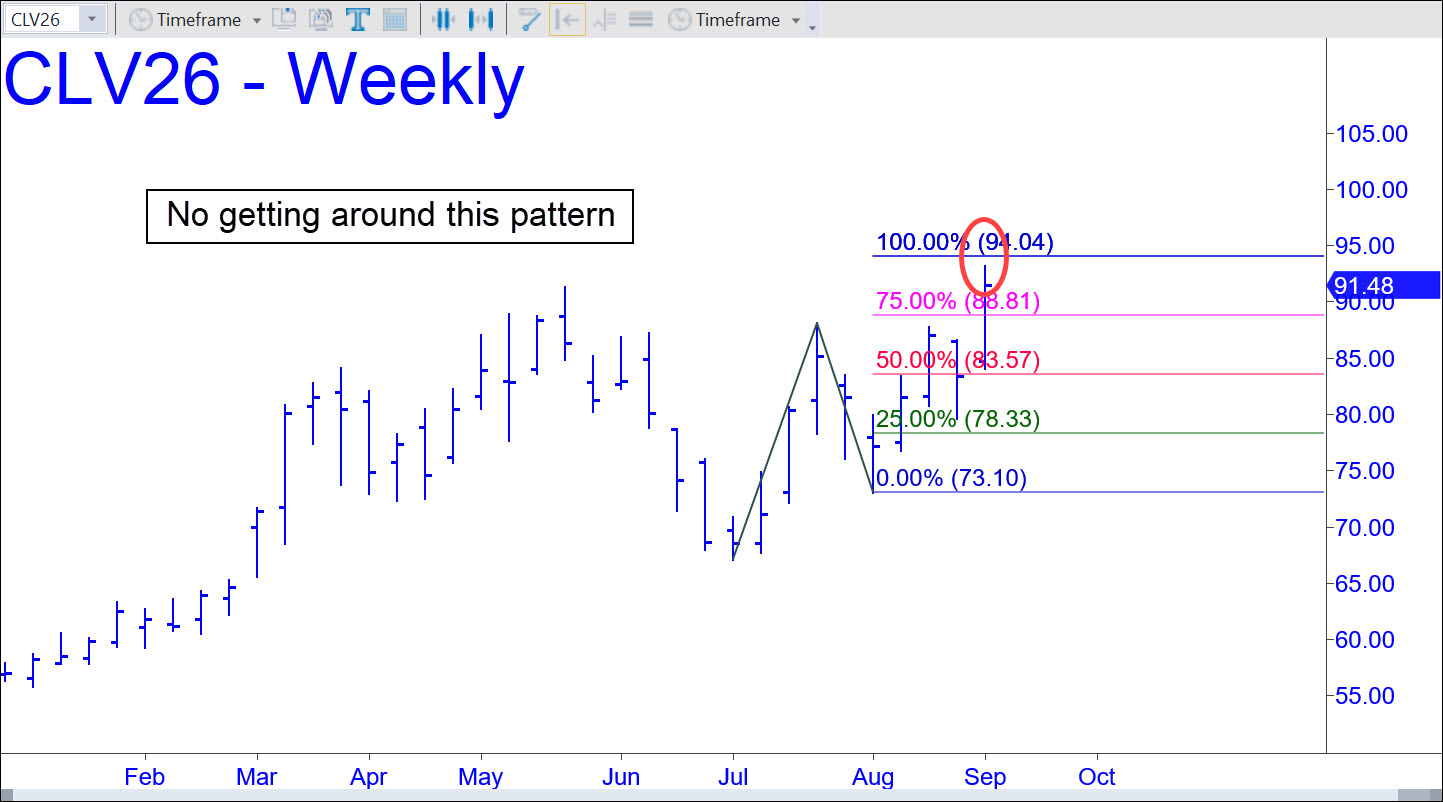
 The chart says last week’s high at 93.14 is about as high as crude prices are going to rise over the near term. There is just a little more room to the upside, with a theoretical ‘cap’ at 94.04. Does this portend an end shortly to the Mideast war and an easing of energy prices? If the chart is right, it’s difficult to imagine another outcome. However, I’ll allow for one alternative scenario nonetheless: a head-fake to 99.34. That’s a midpoint HP resistance culled from a continuous weekly chart, and although its resistance will not likely work out precisely to-the-pen. ny, it is good enough for government work. If, heaven forbid, the futures were to break out above that number, it would open up a path to as high as 115.48, or even 131.63. _______ UPDATE (Sep 8, 9:52 a.m.): The overnight feint to 94.73 exceeded my rally target more than marginally and is therefore bullish, especially because the target does not appear to have been front-run. We’ll give the pullback time to develop before we draw and further inferences, but it will need to exceed at least two external lows before we can give bears the benefit of the doubt. From here, the nearest lies at 92.12, and the second at 90.87. These structural supports are relatively minor, however, and it won’t be until last Thursday’s 88.72 low is breached that the selling will start to look promising.
$CLV26 – October Crude (Last:91.48)