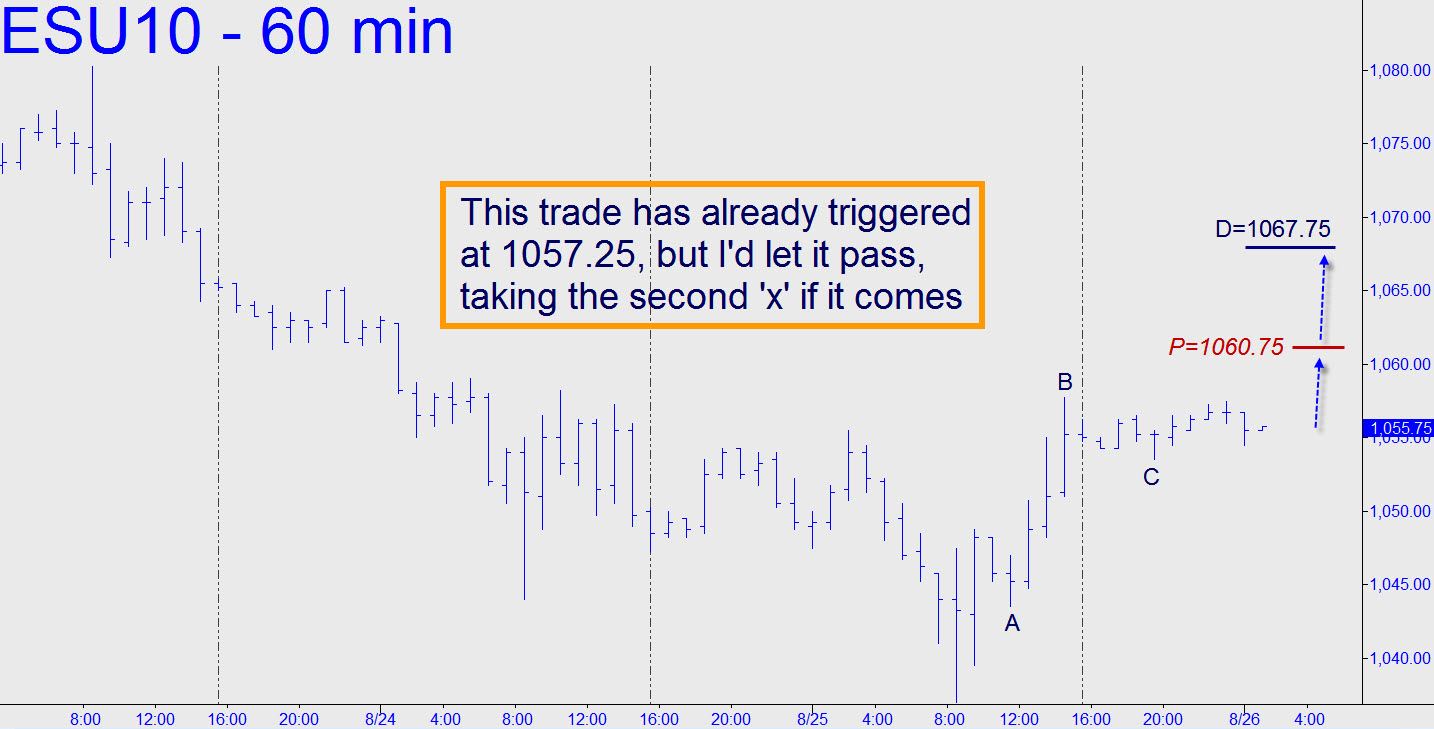
 Yesterday’s swoon just missed my target, although a couple of eagle-eyed pivoteers in the chat room noticed that by NOT using the one-off ‘A’ to do the calculation, as is my habit, one could have nailed the 1037.00 intraday low to-the-tick. I’d do it again if faced with the same choice, however, since I’ve always been a sucker for hottie, one-off ‘A’s like the one in this case. So now what? The subsequent rally created a bullish impulse leg on the hourly chart, confirming my earlier suspicion that the market has been too, too resilient recently in the face of some of the worst economic news since the 1930s. But then, I’d already mentioned my skepticism about the Hindenburg Omen, which has flashed three — count ’em, t-h-r-e-e! — signals lately. It couldn’t have helped that even the Wall Street Journal took note of ‘Hindenburg’ this time around. For my part, I’ll simply go with the flow for now, drum-rolling the 1067.75 rally target shown in the chart. Its sibling midpoint is 1060.75, and any rally that exceeds that number would imply more upside to the target itself. Of course, all bets would be off if the point ”C’ low is breached first. As of around 2:30 a.m., it was still in play, albeit barely. Note to night owls: I don’t trust this one, but if a second point ‘C’ forms you should jump on the new ‘X’ trigger with a buy-stop. _______ UPDATE (12:04 p.m. EDT): Waiting for a second ‘C’ to form as suggested would have worked nicely, triggering a long entry at 1057.25 and partial-profit-taking at 1060.75, the Hidden Pivot midpoint of the pattern. The futures turned flaky 1.00 point above it, though, and went into gratuitous spasms on the regular-session opening. They are trading slightly lower on the day at the moment, but it still looks like bears are having a tougher time of it than bulls.
