
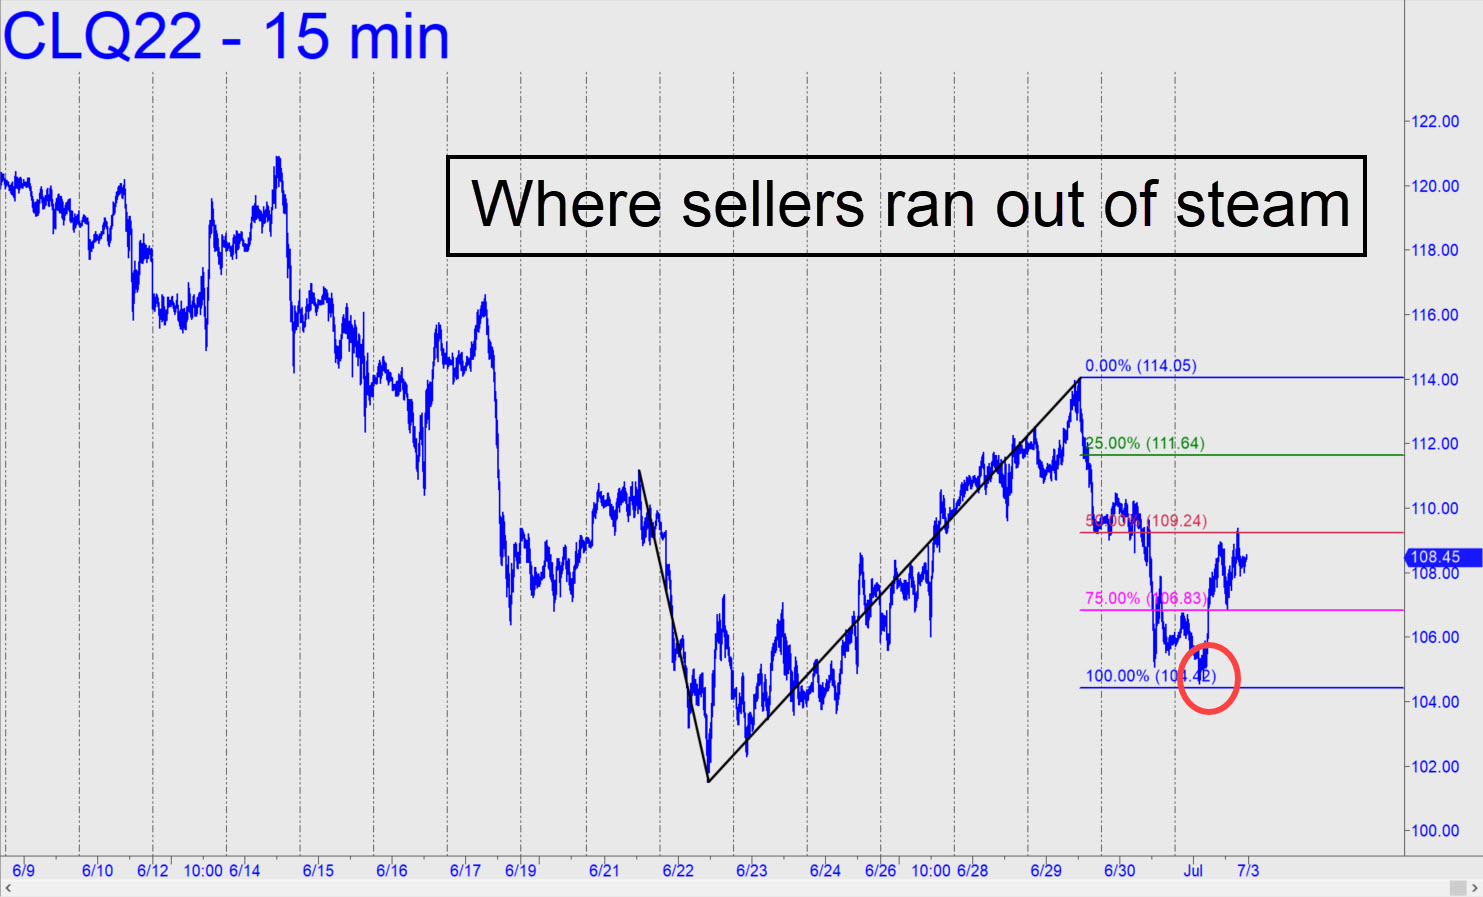
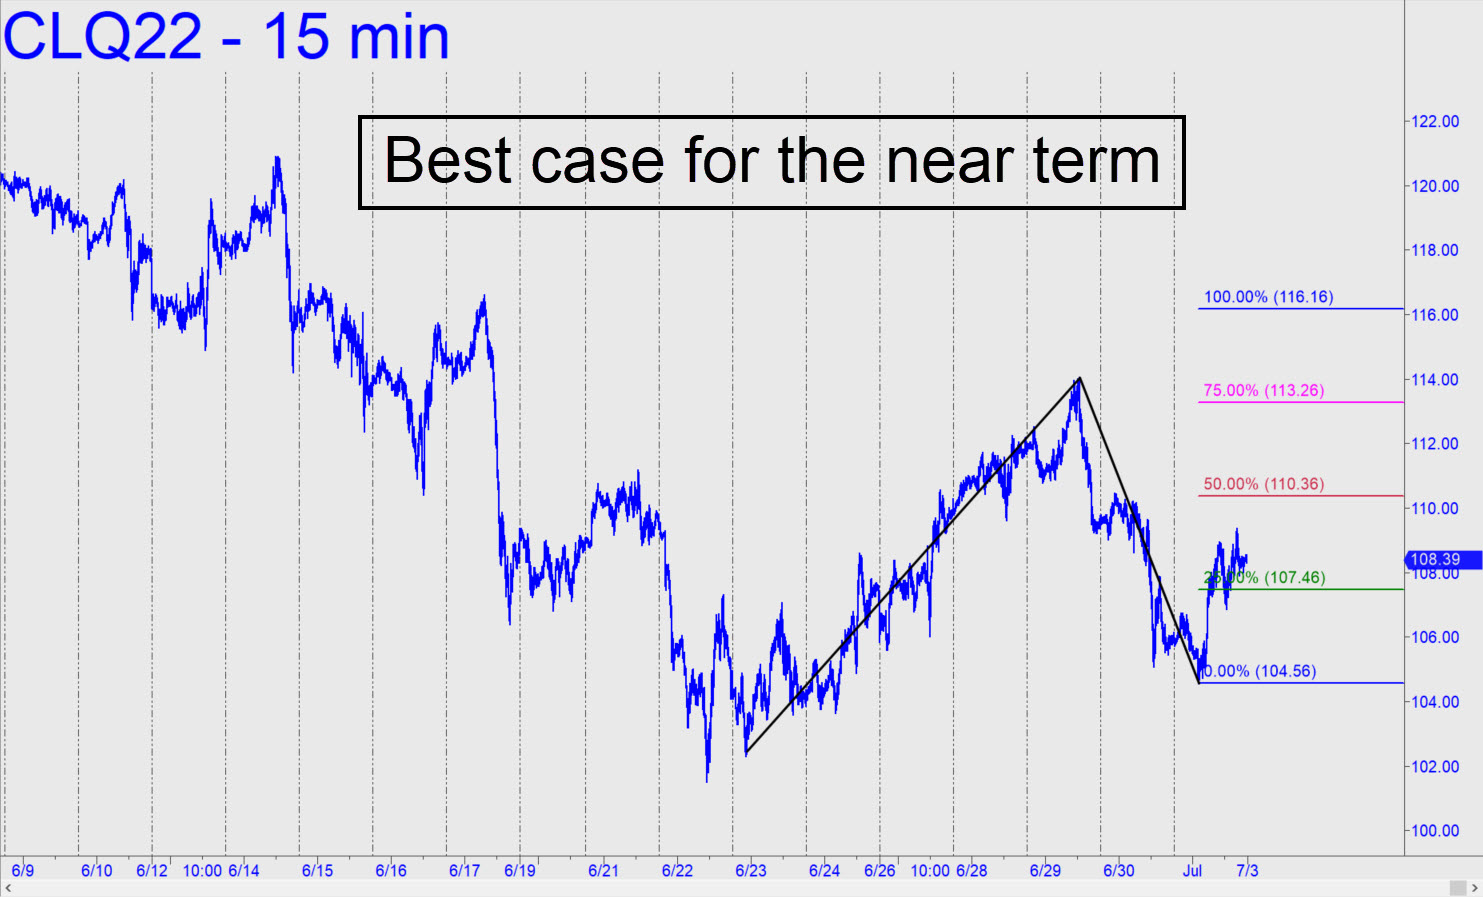
 Sellers ran out of steam precisely at the 104.42 target shown in the chart. This implies the so-far one-day bounce could travel a bit farther or even get legs, since the pattern took fully two weeks to play out. I’d proffered a 105.52 downside target initially, but when it was somewhat exceeded, a new target was warranted. The one in the chart was calculated simply by sliding ‘A’ up a notch above the original one-off. Now, if the uptrend exceeds c=114.05 of the reverse pattern, we should infer 116.29 as a target. Here is the chart from which it is derived. Please note that one coordinate was slightly off and that the corrected target, as implied above, is 116.29, with p=110.43. (I have not corrected the actual chart.) _______ UPDATE (Jul 5, 9:21 a.m.): Last night’s vicious little head-fake above p=110.82 reminds me of NatGas, which is always out to cripple and maim those who are capable of getting the trend and the swings right consistently. In retrospect, and in this particular instance, this behavior justifies using an ABCD pattern anchored at 101.53, a ‘marquee’ low. It yields a D target at 117.08 that is about to become moot with a presumptive feint below C=104.56. Incidentally, I am not buying into the bullish story that the resurgence of China’s manufacturing sector is about to drive energy prices to the moon. _______ UPDATE (Jul 6, 8:16 p.m.): We used this pattern to trade a 94.70 downside target. Given the precise hit at p and its subsequent destruction, I cannot fathom why the target was not achieved within three pennies or less. Perhaps one last swoon is needed to finish the job? ______ UPDATE (Jul 7, 6:02 p.m.): Evidently not. The futures went ballistic today off yesterday’s 95.10 low, and that’s pretty bullish.
CLQ22 – August Crude (Last:102.45)
Posted on July 3, 2022, 5:15 pm EDT
Last Updated July 7, 2022, 6:01 pm EDT