
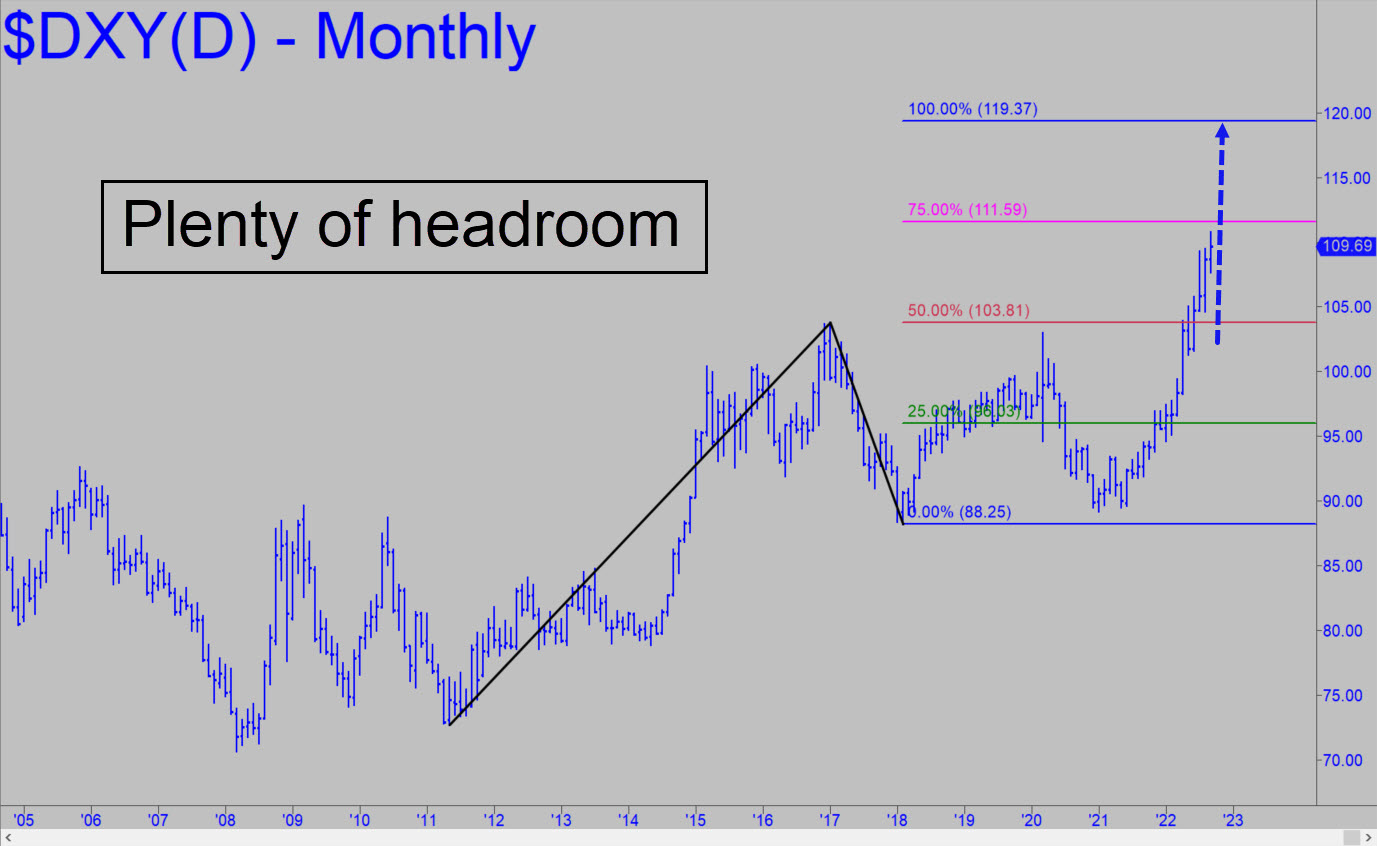
 The Dollar Index is headed toward an interim top at 113.16, a Hidden Pivot resistance that would culminate a bull trend begun from around 79 in 2014. However, there is an even longer-term target at 119.37 that is shown in the inset. Both uptrends could experience significant corrections along the way, but the retracement that has played out over the last week or so from a peak at 110.79 would generate a ‘mechanical’ buy signal at 106.64 (stop 104.64: weekly chart, A=101.30 on 6/3). I’ve provided a big-picture perspective this week to explain why any weakness in the dollar, even if severe, would not jeopardize the very bullish projections possible using charts that go back as far as 20 years. This would be true even if the dollar were to fall to the green line (96.03) shown in the chart. Presumably, this would require an unprecedented money-printing spree, or a geopolitical shock severe enough to knock the dollar off its pins.
DXY – NYBOT Dollar Index (Last:109.69)
 Posted on September 18, 2022, 5:13 pm EDT
Last Updated September 18, 2022, 9:59 pm EDT
Posted on September 18, 2022, 5:13 pm EDT
Last Updated September 18, 2022, 9:59 pm EDT