
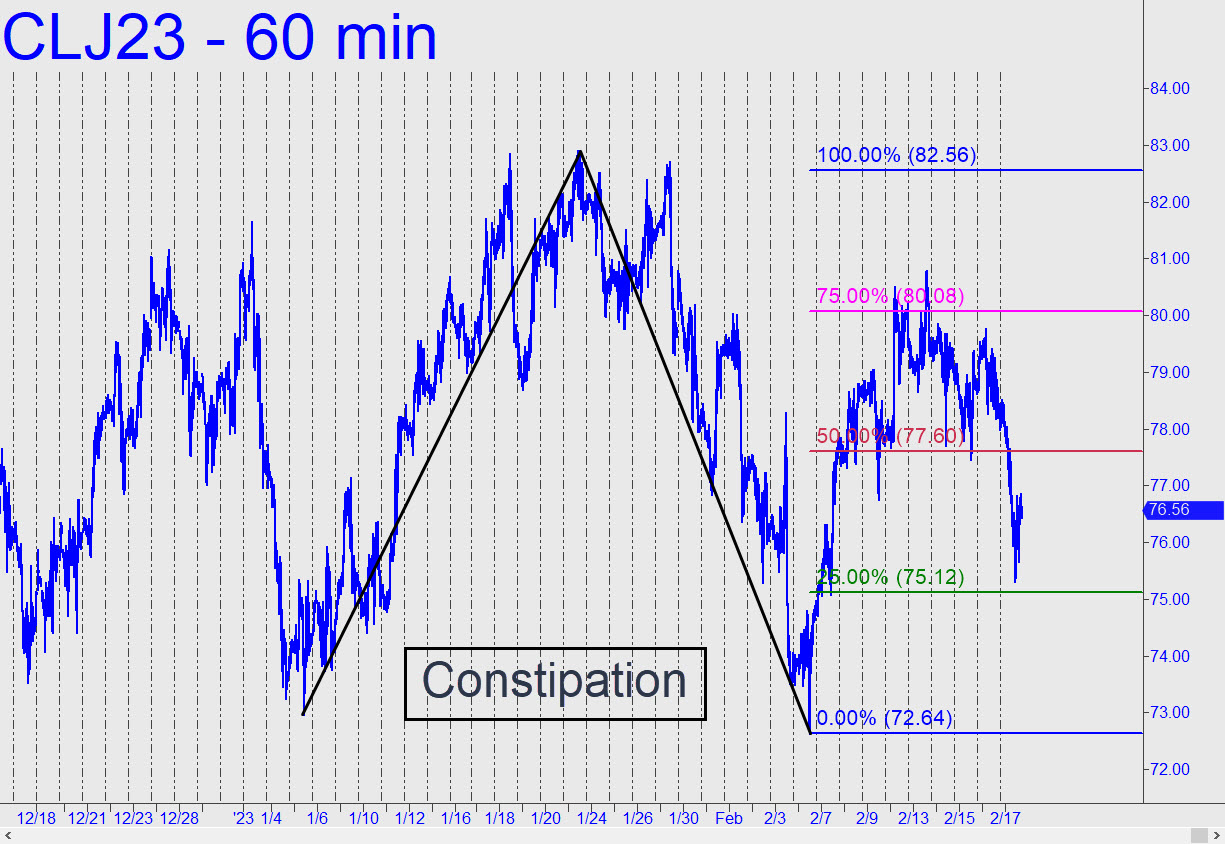
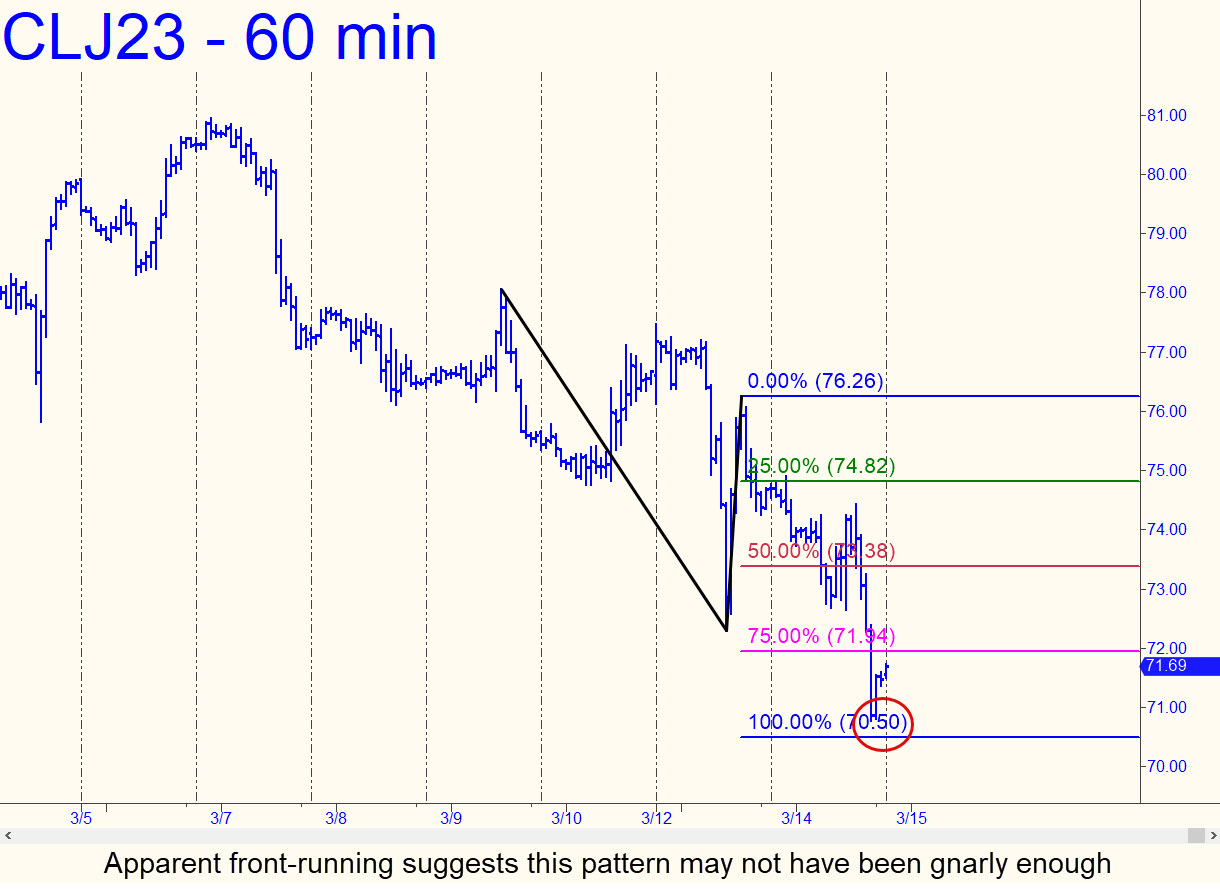
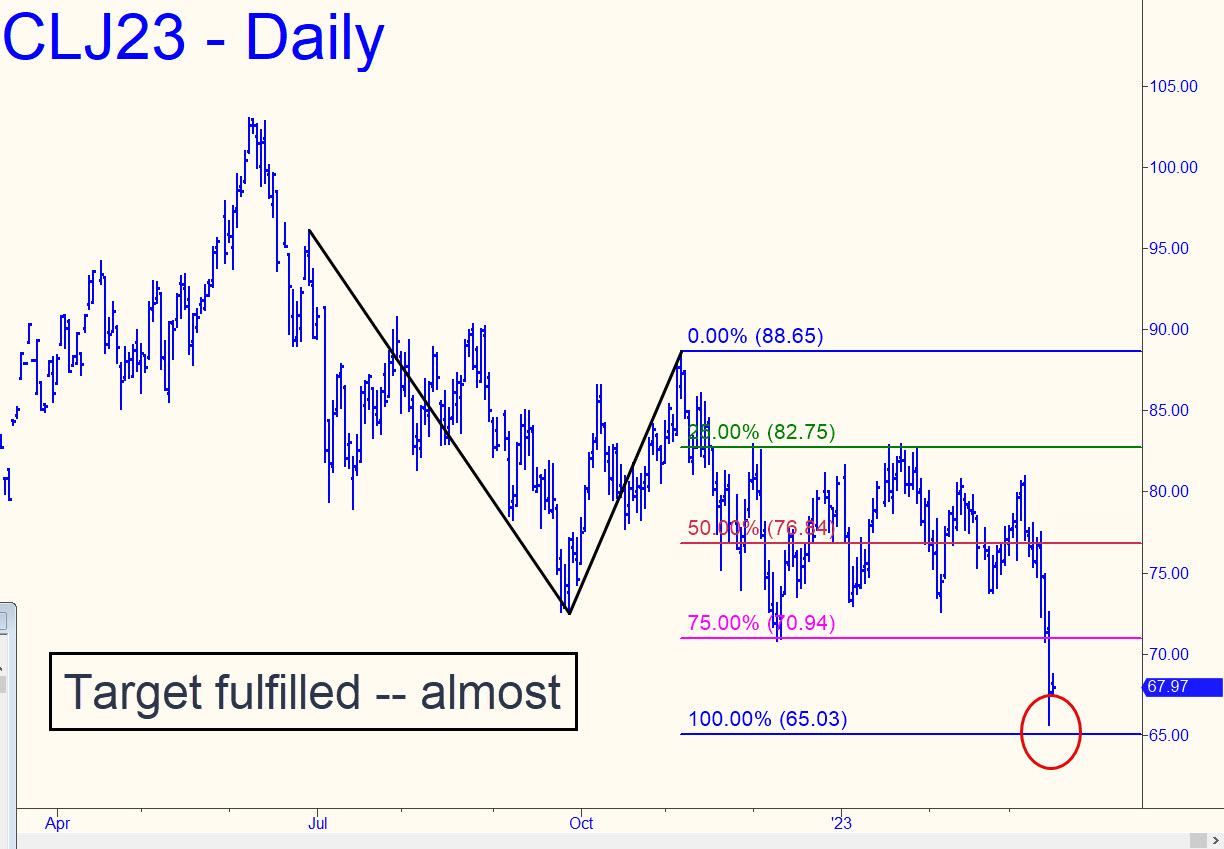
 I’ve drawn a pattern that should suffice to contain the constipated price action of this flaky proxy for global manufacturing. What you can expect in the week ahead is more range-bound trading, but with the prospect of an enticing ‘mechanical’ buy if the April contract should come down to the green line (x=75.12). The implied entry risk of $10,000 on four contracts is too steep to initiate the trade conventionally, but it may be possible to cut that by as much as 90% with close attention to bullish entry patterns on the lesser charts. Stay tuned to the chat room if interested. _______ UPDATE (Feb 22, 10:01 p.m.): The trade mentioned above triggered, but only on paper, since no one mentioned it in the chat room. Whatever happens next, even if it’s a breakdown, promises to be as inconsequential as everything else that’s occurred on the daily chart since August. _______ UPDATE (Feb 25): Zzzzzzzzzzzzz. _______ UPDATE (Mar 11): Zzzzzzzzzzzzzzzzzzzz. _______ UPDATE (Mar 13, 6:40 p.m.): April Crude looked ripe for bottom-fishing this afternoon, based on the 70.50 D target shown in this chart. Alas, the futures turned higher from just above it, mooting the opportunity. The pattern seemed gnarly enough to work, but the fact that the three coordinates are so obvious when viewed at-a-glance might have argued otherwise. Today’s price action leaves me more open to the possibility that crude may be carving out a short-term bottom. _______ UPDATE (Mar 15, 11:58 p.m.): Crude carved out a possible bottom all right (see above) — with the steepest one-day plunge since July! The 65.65 low was foreseeable, or very nearly so, but arguably too distant from D=65.03 to cue up the kind of tight-fisted rABC entry we prefer. The bounce was ferocious, but it remains to be seen whether it will suffice to shake out the last of the sellers. Many were evidently capitulating on margin calls.
CLJ23 – April Crude (Last:67.89)
Posted on February 19, 2023, 5:12 pm EST
Last Updated March 17, 2023, 5:40 am EDT