
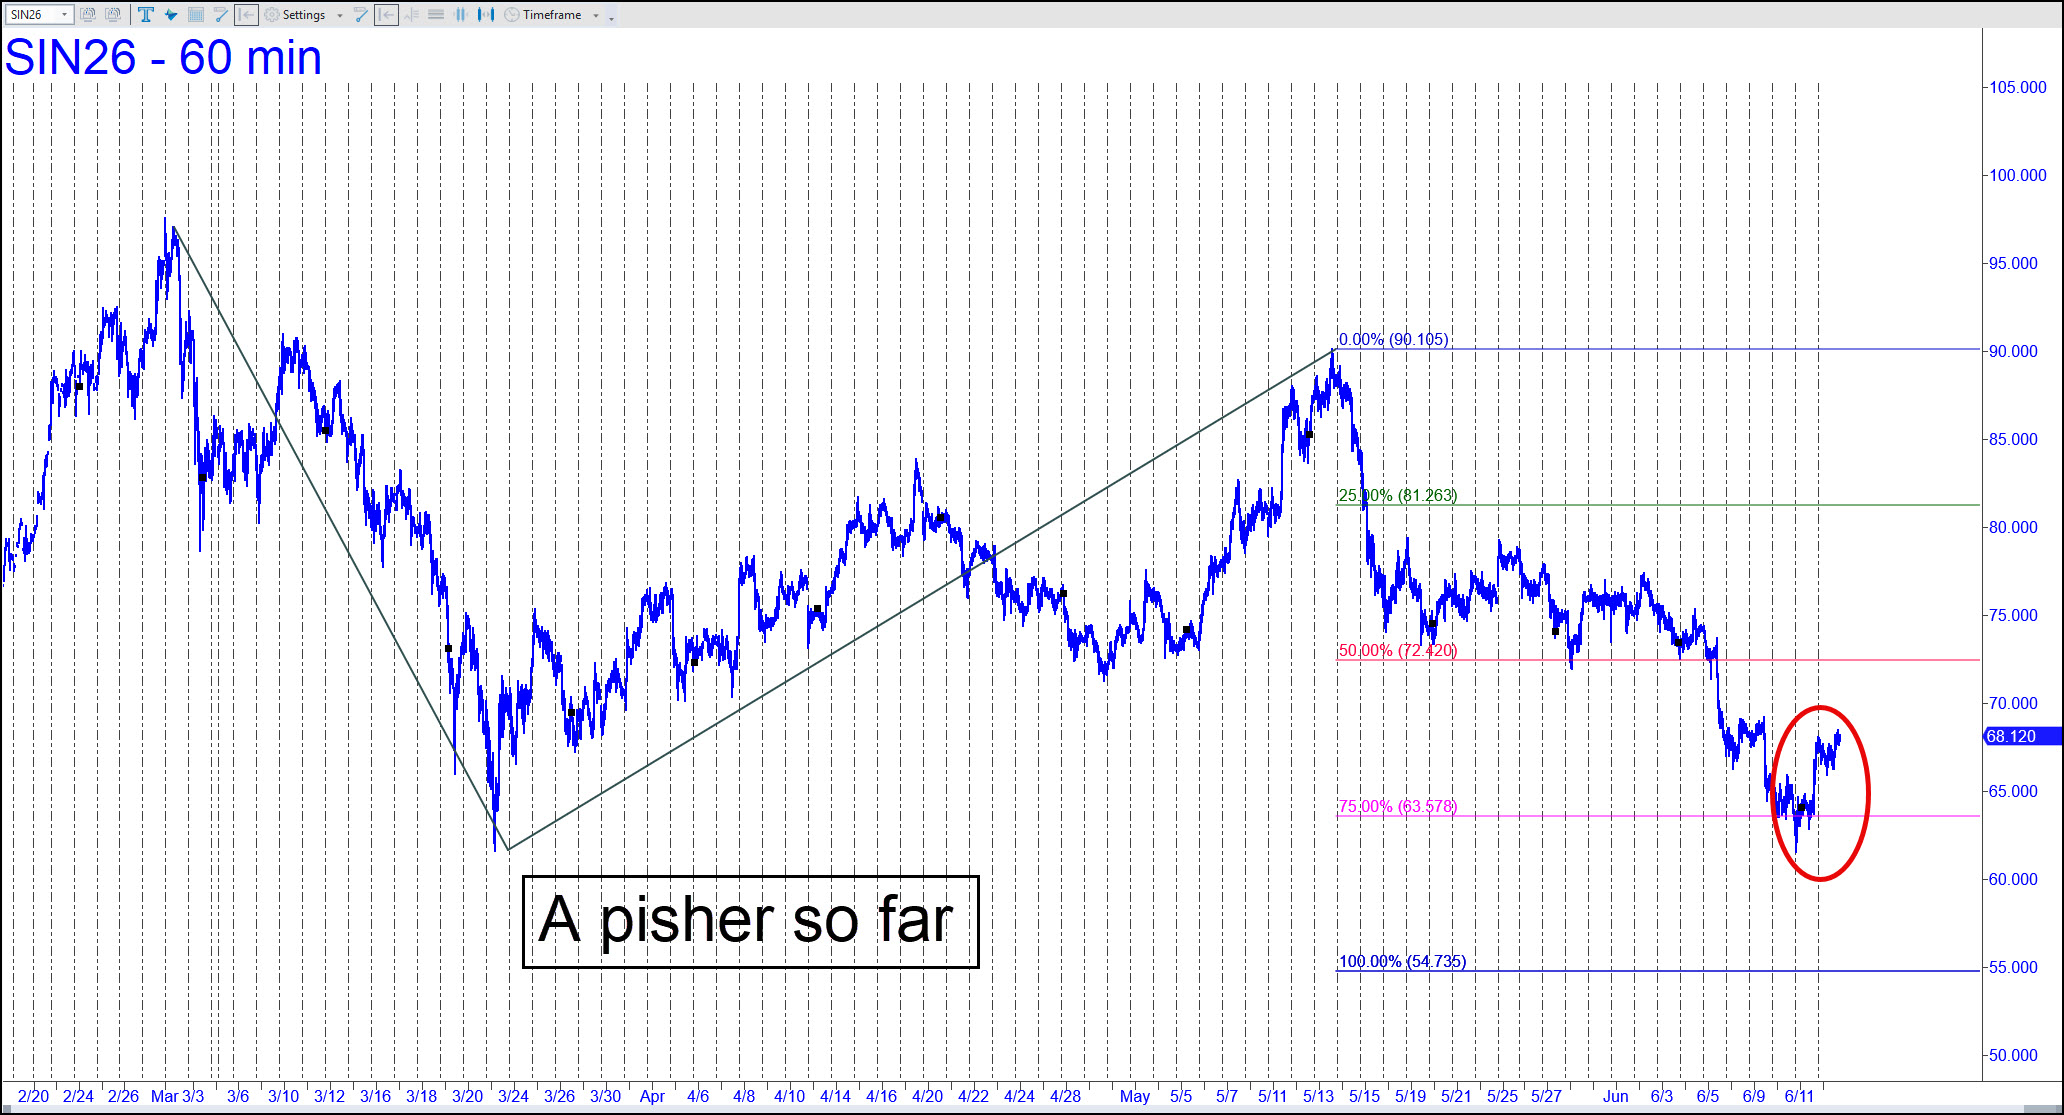
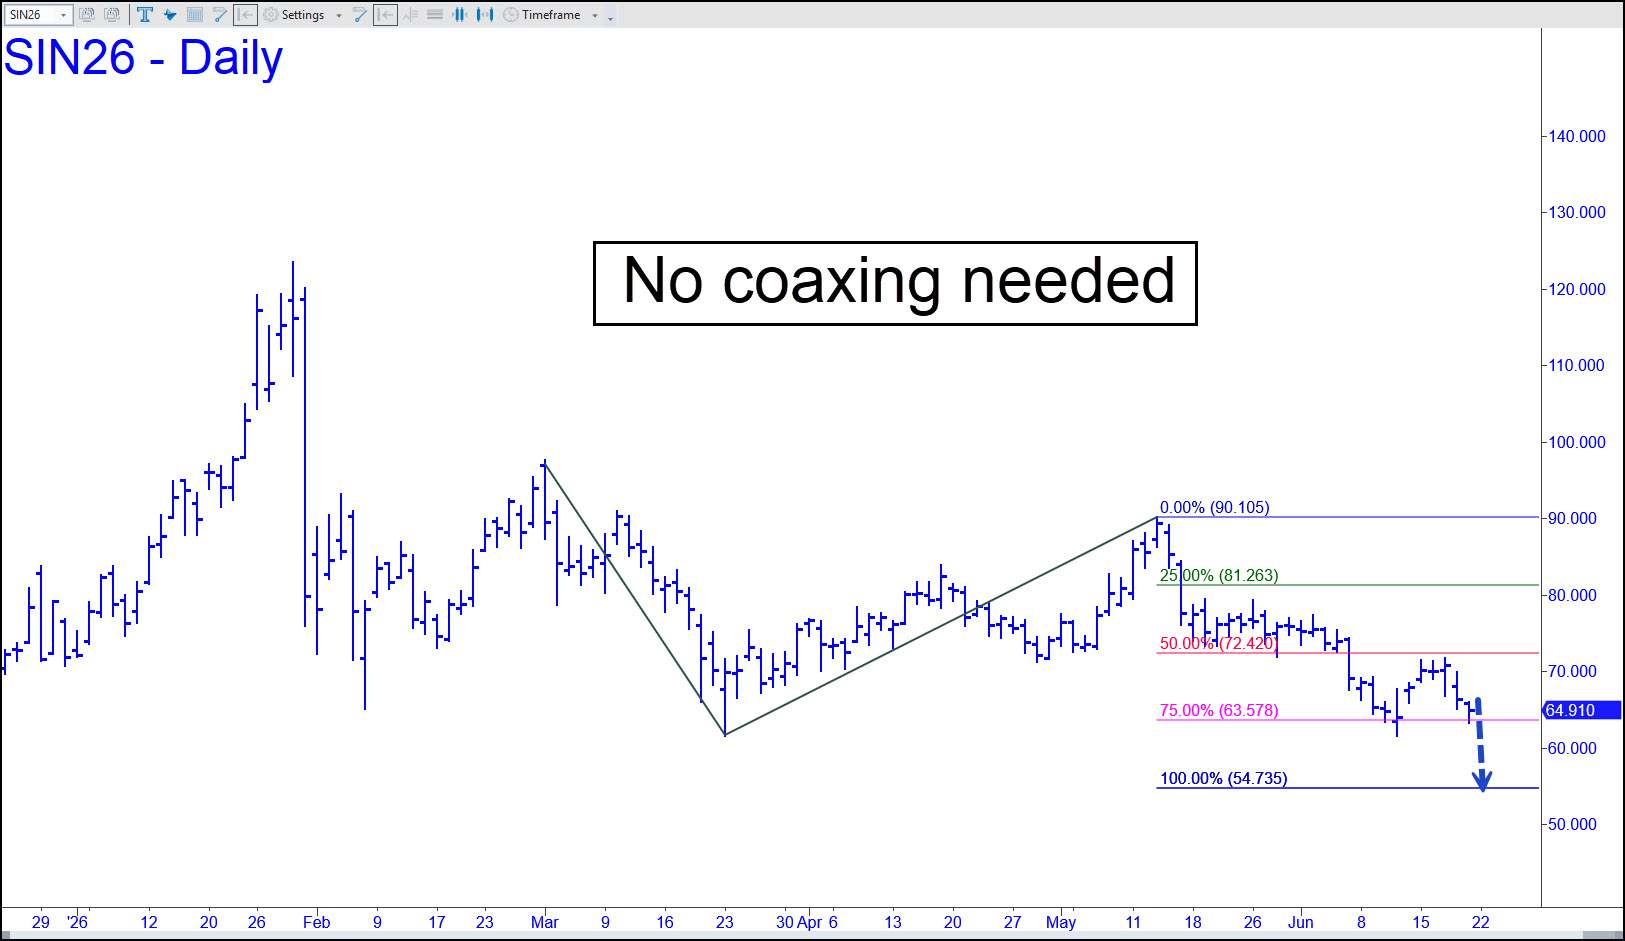
 Friday’s rally mirrored gold’s, meaning you shouldn’t get your hopes too high. The pattern suggests that once the bounce ends and silver resumes its downward course, it could eventually go as low as 54.735. That’s 20% below these levels, meaning a whole ‘nother bear market could unfold before Ag finds a bottom. If that sounds overly bearish, we can allow for the possibility that bulls have turned things around if the July contract surpasses the 77.355 peak recorded on June 2. For current purposes, however, we’ll plan on trading with a bullish bias if and when the futures push above last week’s 68.800 peak. That would generate a bullish impulse leg on the hourly chart, brightening the short-term outlook. _______ UPDATE (Jun 21): As expected, a weak rally died before the futures could surpass even a single Hidden Pivot level on the daily chart. By week’s end, they appeared on track again for a fall to the 54.735 target shown. That would equate to a 53% drop since spot quotes peaked in late January around 123. _______ UPDATE Jun 24, 8:53 a.m.): On July Silver’s daily chart going back to February, there are more downtrending ABC patterns driving it lower than I can parse — and zero ABC uptrends on any chart of any degree. Worst-case technically is 39.305 (!), but that is much lower than I can imagine, given the strong industrial demand for silver in the Western world. My best case would be a bounce from here (i.e., 58.409), the p2 pivot of A=79.250 on 5/26); or, far more likely, from either of two more or less coincident supports at D=53.995 or p2=53.865 (A=.123.45 on Jan 29).
SIN26 – July Silver (Last:58.820)
Posted on June 21, 2026, 5:14 pm EDT
Last Updated June 25, 2026, 10:53 am EDT