
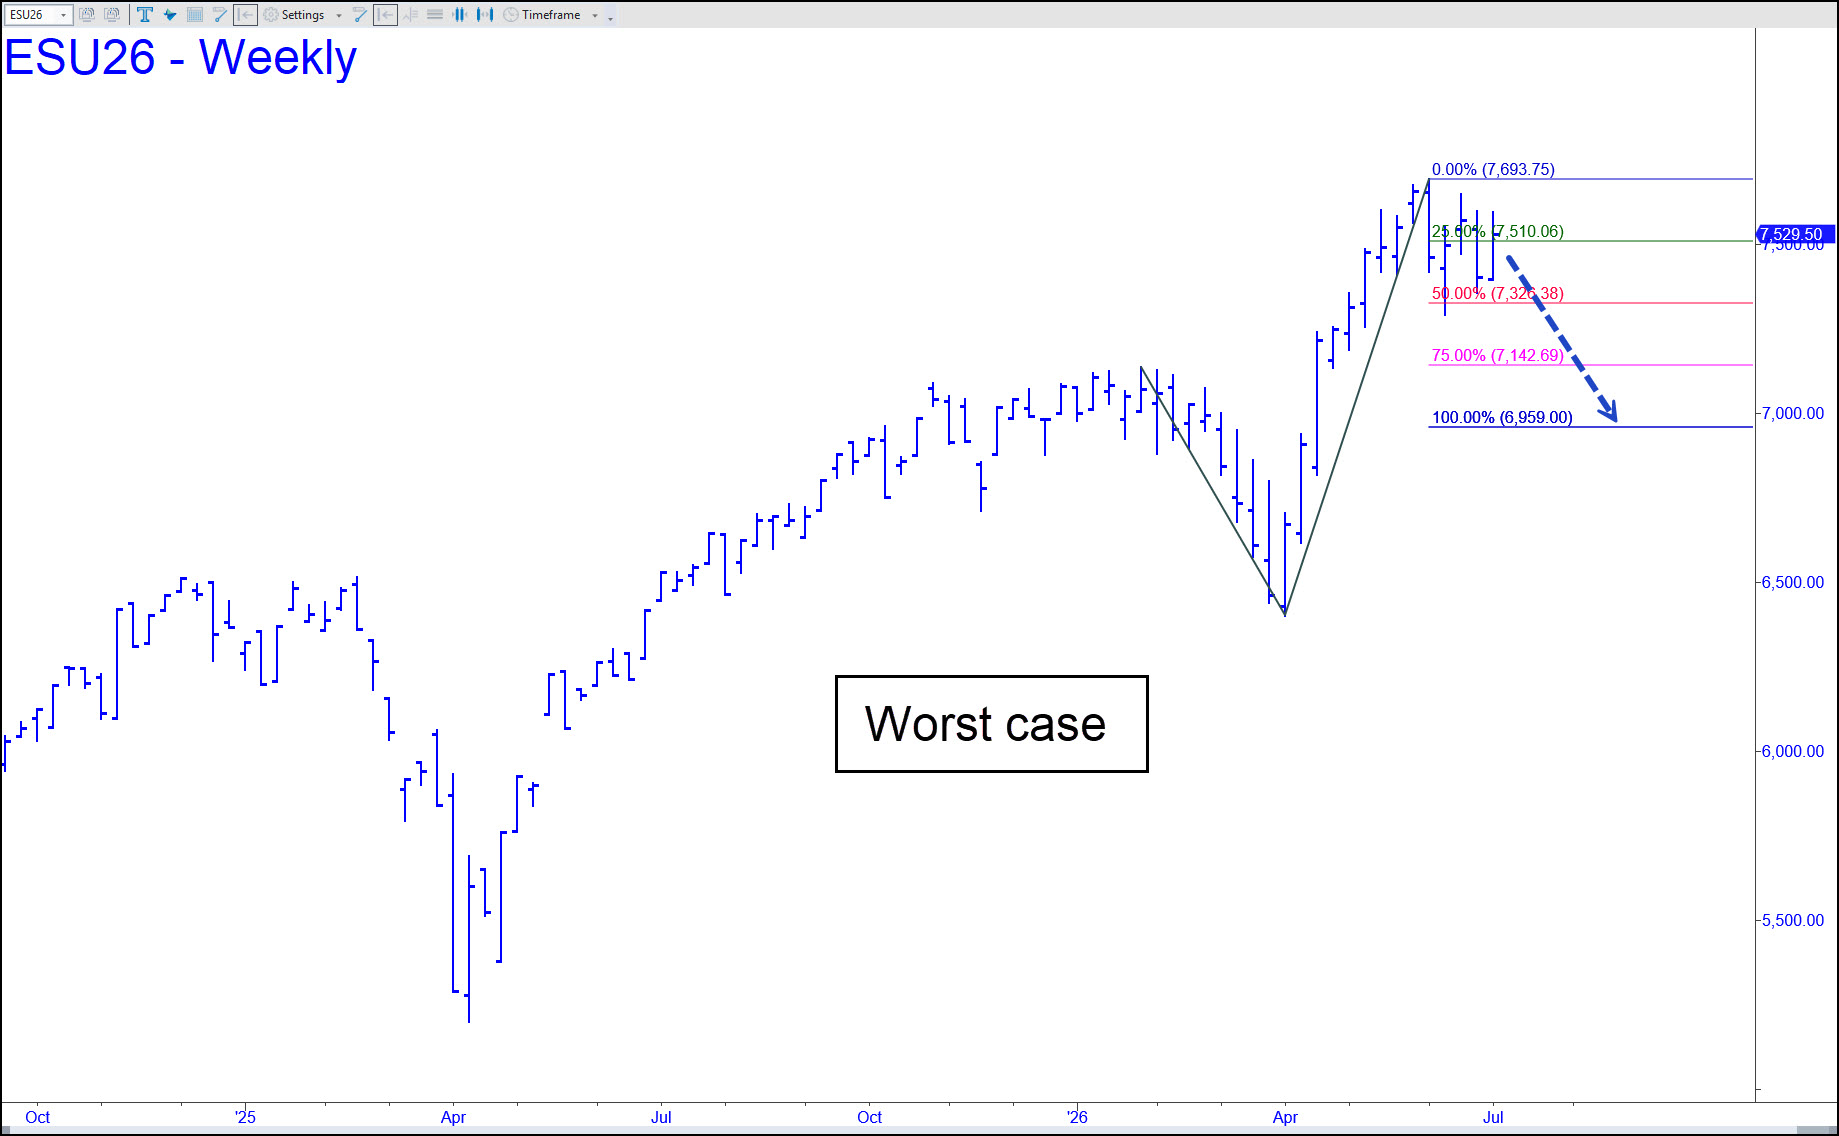
 On the weekly chart, the futures have been on a ‘mechanical’ sell signal since mid-June. They seem in no hurry to do what they ought — i.e., fall to the modest, 6959.00 target of the pattern shown. That would equate to a 7.5% correction from these levels and 9.5% from the record-high 7694 notched in the first week of June. That’s the worst I could see at the moment, and it would be the kind of garden-variety correction that would draw in buyers who have been waiting for a token discount. But fear? Not hardly. The low would likely come in the middle of August, however, leaving enough time for plenty of fear to develop ahead of the November elections. Fear of what, you ask? The possibilities are too numerous to predict, so let’s focus instead on ways to chase boredom during what promises to be a dull, glum summer on Wall Street.
ESU26 – September E-Mini S&P (Last:7532.00)