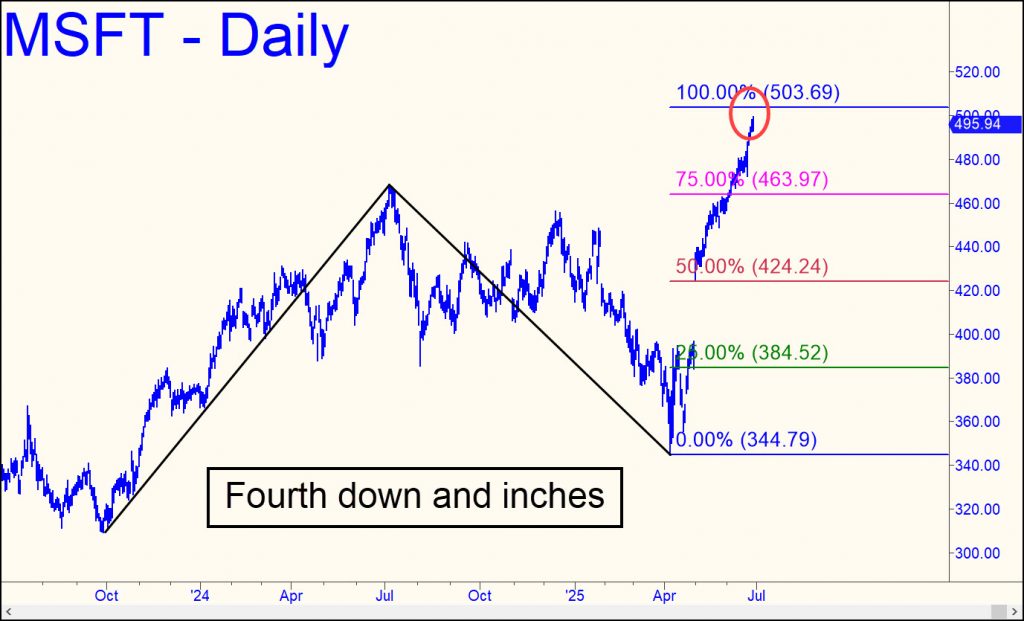
$MSFT – Microsoft (Last:498.00)
The grandaddy of all short squeezes (in dollar terms) stopped an inch shy of the 503.69 target we’ve been using. It looks like ‘our’ target got front-run on the intraday charts, but the view shown, of the daily chart, ‘feels’ like the target will be achieved. In any case, we
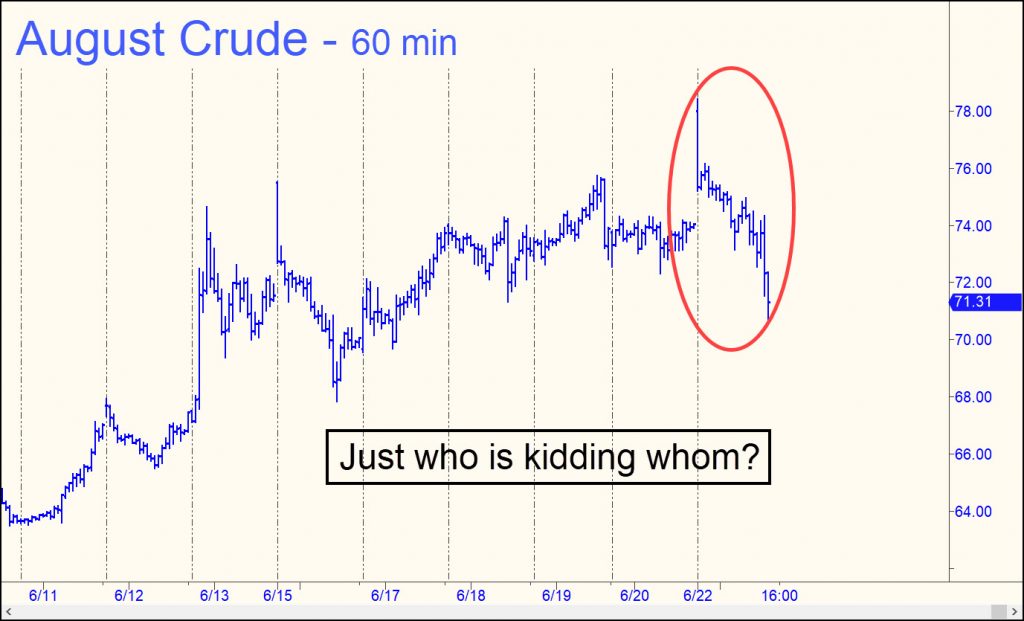
CLQ25 – August Crude (Last:66.71)
Right on cue, Bloomberg.com splashed an article on its front page over the weekend explaining why the price of crude has been so subdued in the face of potentially severe supply disruptions in the Middle East. Turns out the world is awash in oil, the article explained — not just
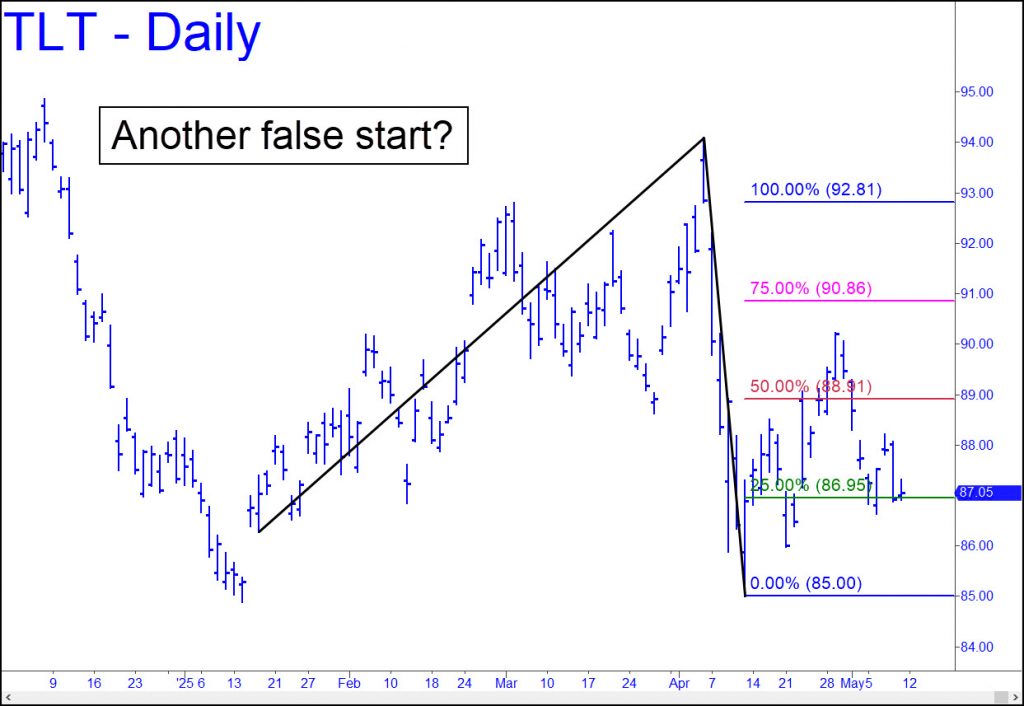
TLT – Lehman Bond ETF (Last:84.55)
We should know soon whether Silver’s mini-explosion upward, the second in three months, is just another false start. From a Hidden Pivot perspective, the selloff of the last two weeks is not as bearish as it seems. It triggered an attractive ‘mechanical’ buy on Monday when it touched the green
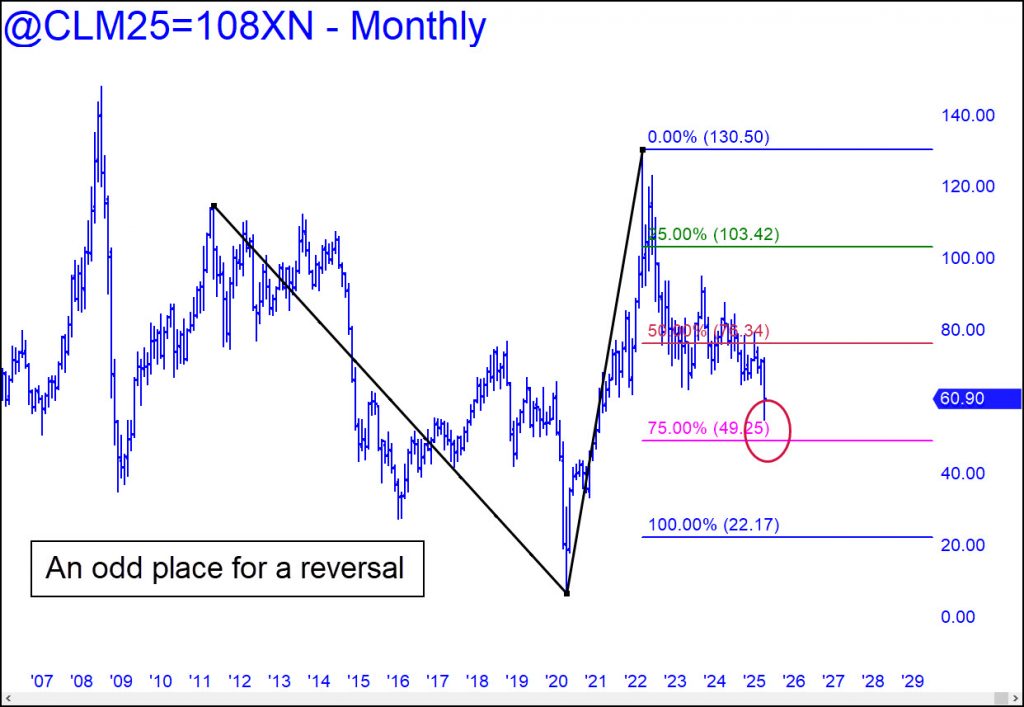
CLM25 – June Crude (Last:60.90)
Quotes for crude have turned up from an odd place, well shy of a ‘secondary’ Hidden Pivot support at 49.25. Odds of a relapse will depend on how bulls fare pushing past a minor Hidden Pivot resistance at 62.22, and another at 65.68 (60-min, A=56.42 on 4/9). If both of
The Huge AI Story May Not Be Quite Huge Enough
The S&Ps and Nasdaq hit record highs last week, a surreal milestone that only the Wall Street toadies at Bloomberg and the Wall Street Journal who fabricate the news could take seriously. These are the same folks who bestowed the name ‘Magnificent Seven’ on a bunch of high-flying stocks whose short-squeeze histrionics qualify them for membership in a stock-market Hall of Shame. Portfolio managers, who surely know better, are go-along buyers at these heights and will remain so until a tsunami of redemptions bends them to the impending reality of massive deflationary write-downs when the Everything Bubble bursts.
That reality darkened last week with news that the U.S. economy shrunk at an annualized rate of 0.5 percent in the first quarter. Perennially giddy investors would seem to be betting either that the recession that probably already has begun will be short, or that the statistic itself is a meaningless outlier caused by the world-class uncertainties of Trump’s tariff policies.
A popular explanation for the staying power of the bull market against a backdrop of global storm clouds, geopolitical mayhem and economic sclerosis is that AI will save us from…everything. As the story has it, artificial intelligence will boost worker productivity, improve outcomes from brain surgery, make steering wheels obsolete, turn $20-an-hour paralegals into Clarence Darrows, and lay to rest the arguments of Talmudic scholars. In unfortunate reality, the driving force behind AI is its ability to put people out of work, particularly white-collar employees whose jobs have been untouched so far by robotics.
Can Joe Six-pack Deliver?
That raises the question of how lunatic-sector companies that have invested trillions of dollars in AI development, and who say they plan to invest much, much more, can ever hope to recoup their money, let alone multiply it voluminously as they seem to expect. To state the question another way, what additional goods and services can they possibly sell us to generate untold trillions of dollars in new revenues? Since houses and cars have gone out of reach for the broad middle class, and because AI will put enough people out of work to make the affordability problem even broader and deeper, you have to wonder how we consumers will be able to satisfy the insatiable greed of Mark Zuckerberg, Bill Gates, Sam Altman, Reed Hastings, Jeff Bezos, Larry Page et al. The GDP pie is only so big, and if cutting into Taylor Swift’s share of it is part of their plan, they are in for the fight of their lives.
One could argue that healthcare is the most significant area of the economy where job cuts are unnecessary for AI to create value. Indeed, if AI provides an economical way to construct robust hearts, lungs and pancreas with a 3-D printer, or leads us to a cure for cancer, the economic benefits would be enormous. But they would come mostly in the form of savings, rather than from any vast new sales by providers. Unfortunately for the megacapitalists, any savings, no matter how large, would not remotely suffice to reward the lot of them together with a sustainable growth-stock multiple. But unsustainable growth that need only be imagined? We’ve got a cosmic surfeit of that now, so enjoy it while it lasts. [AI hubris was the focus of my recent interview with Howe Street’s Jim Goddard. Click here to access it.]