
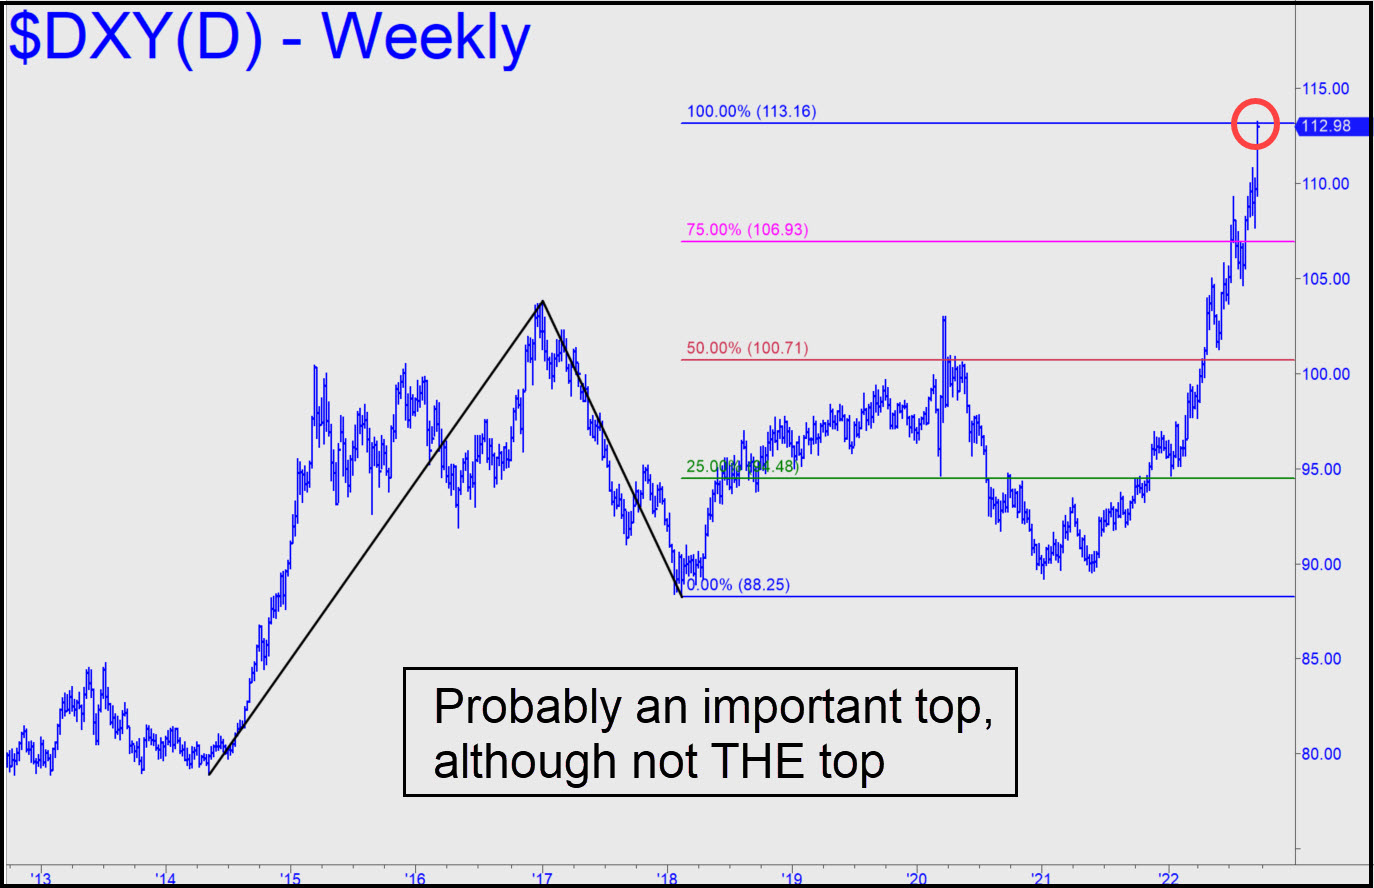
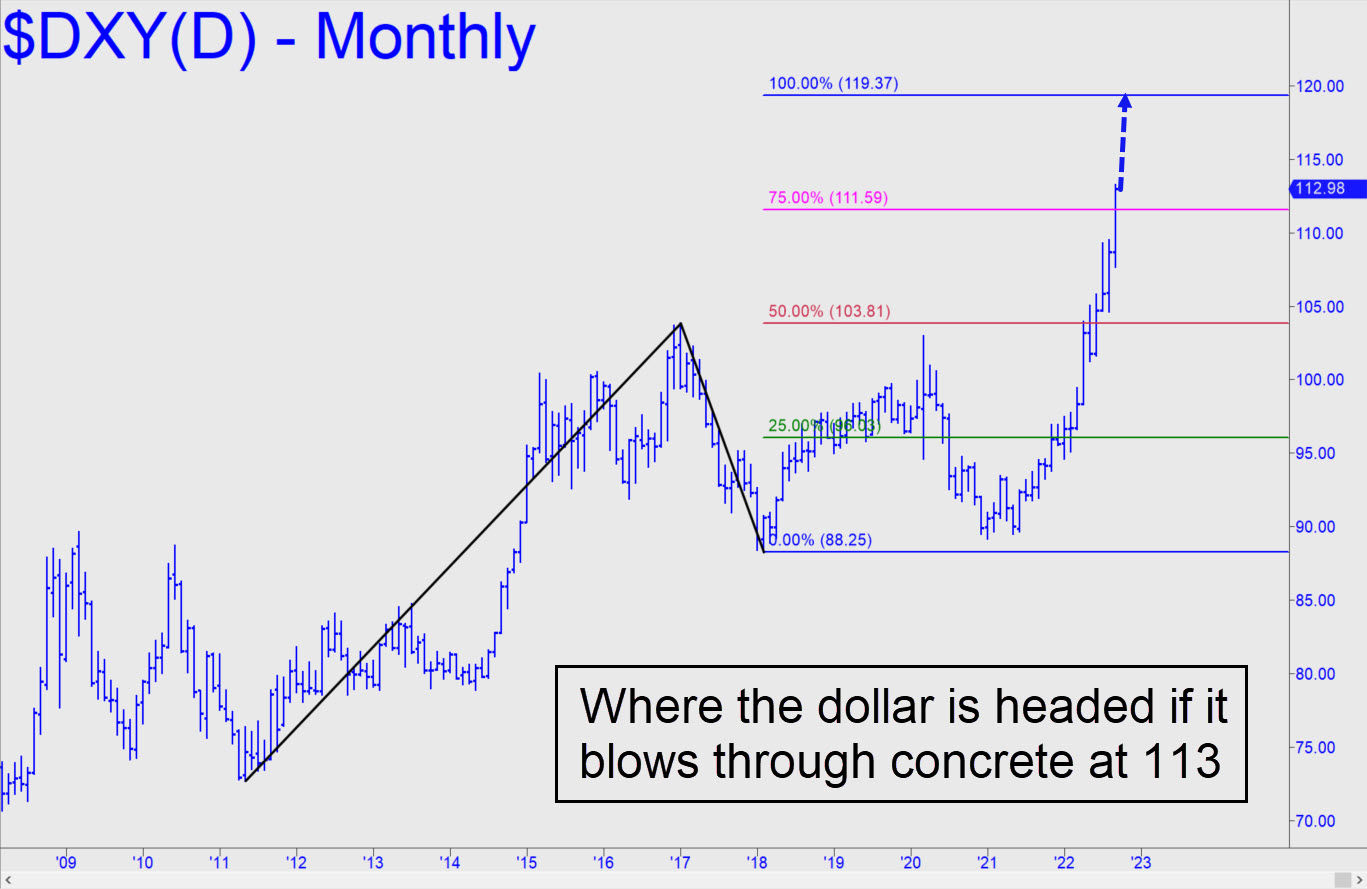
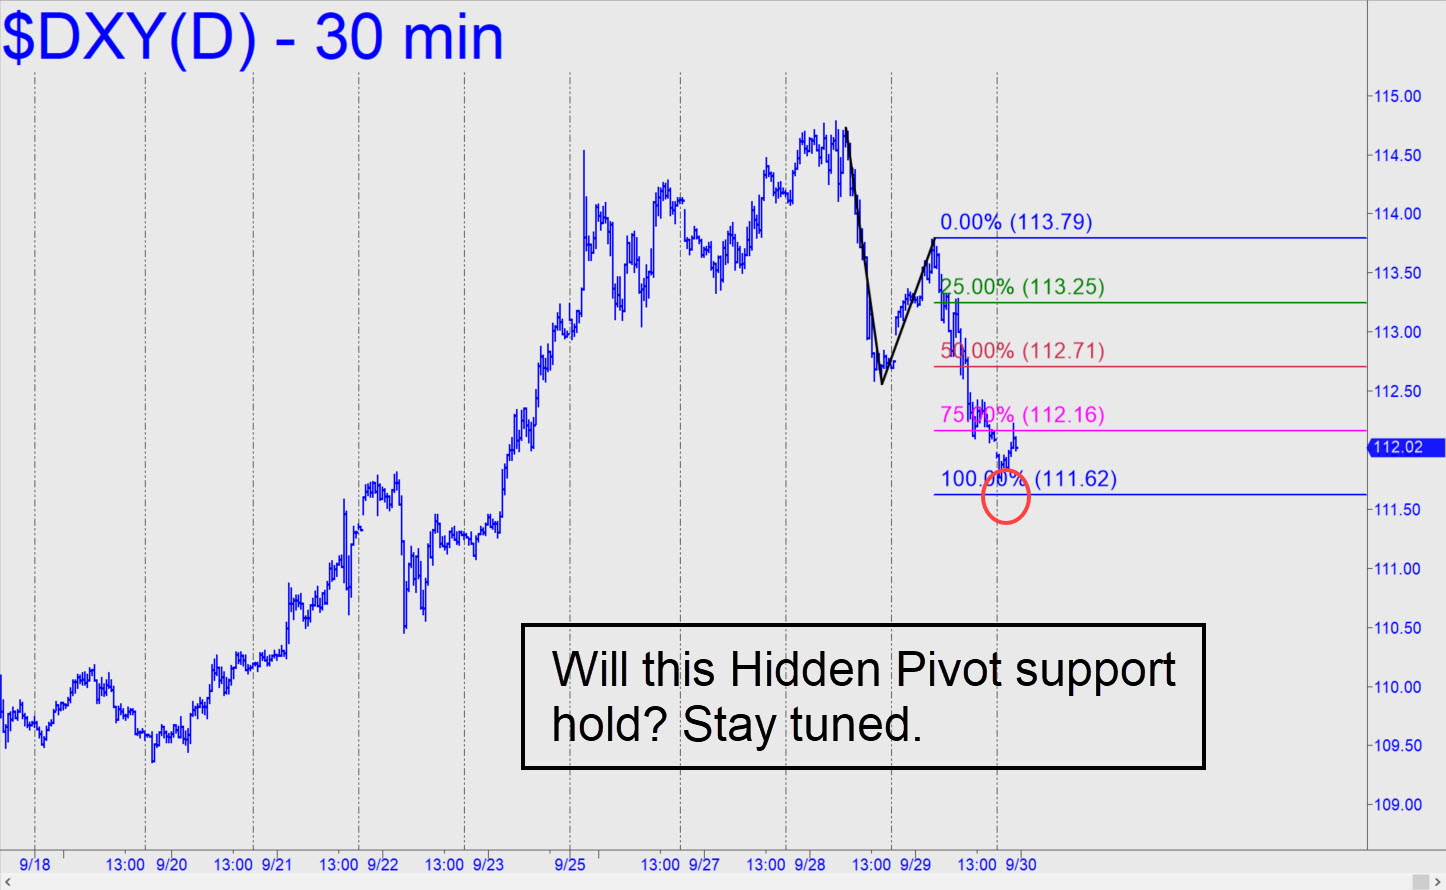
 The Dollar Index peaked on Friday seven cents above a 113.16 target that has been on our radar for more than four years. The pattern took nearly a decade to play out, implying that any correction from these levels could last for quite a while — perhaps 12-18 months or even longer. The retracement presumably would set the stage for a renewed uptrend to the 119.37 target shown in this chart. Please note that although a severe correction down to the green line at 96.03 might be viewed by pundits as nothing less than the death of the dollar, it would in fact trigger an opportune ‘mechanical’ buy signal according to our trading rules. Because the dollar’s daily ups and downs have correlated inversely with nearly every trading vehicle we track, we might expect a resurgence in gold, stocks and T-Bonds, among other investibles, if the dollar is in fact headed into a prolonged decline. There’s also a chance it will power its way past the 113.16 target without a pause and just keep rising. That would suggest that the catastrophic deflation we’ve been predicting for many years is under way. A hardening dollar would tighten the screws on all who owe dollars, including debts arising from short-dollar positions in the $2 quadrillion derivatives market. _______ UPDATE (Sep 27, 5:11 p.m.): Amazing! DXY hasn’t quite shredded the granite Hidden Pivot at 113.16, but it does look like it’s trying to turn the resistance into support. This implies there is still plenty of unspent power pushing the dollar higher. If so, that would be very bad news for the economic world. ______ UPDATE (Sep 29, 11:28 p.m.): DXY has corrected sharply for the last two days after exceeding the target of a long-term pattern. If the retracement is going to be short-lived, the 111.62 Hidden Pivot support shown in this chart must hold. _____ UPDATE (Oct 4, 11:49 p.m.): The support mentioned above got crushed, presumably dooming DXY to purgatory for an indeterminate period.
DXY – NYBOT Dollar Index (Last:110.43)
Posted on September 25, 2022, 5:22 pm EDT
Last Updated October 4, 2022, 11:49 pm EDT