
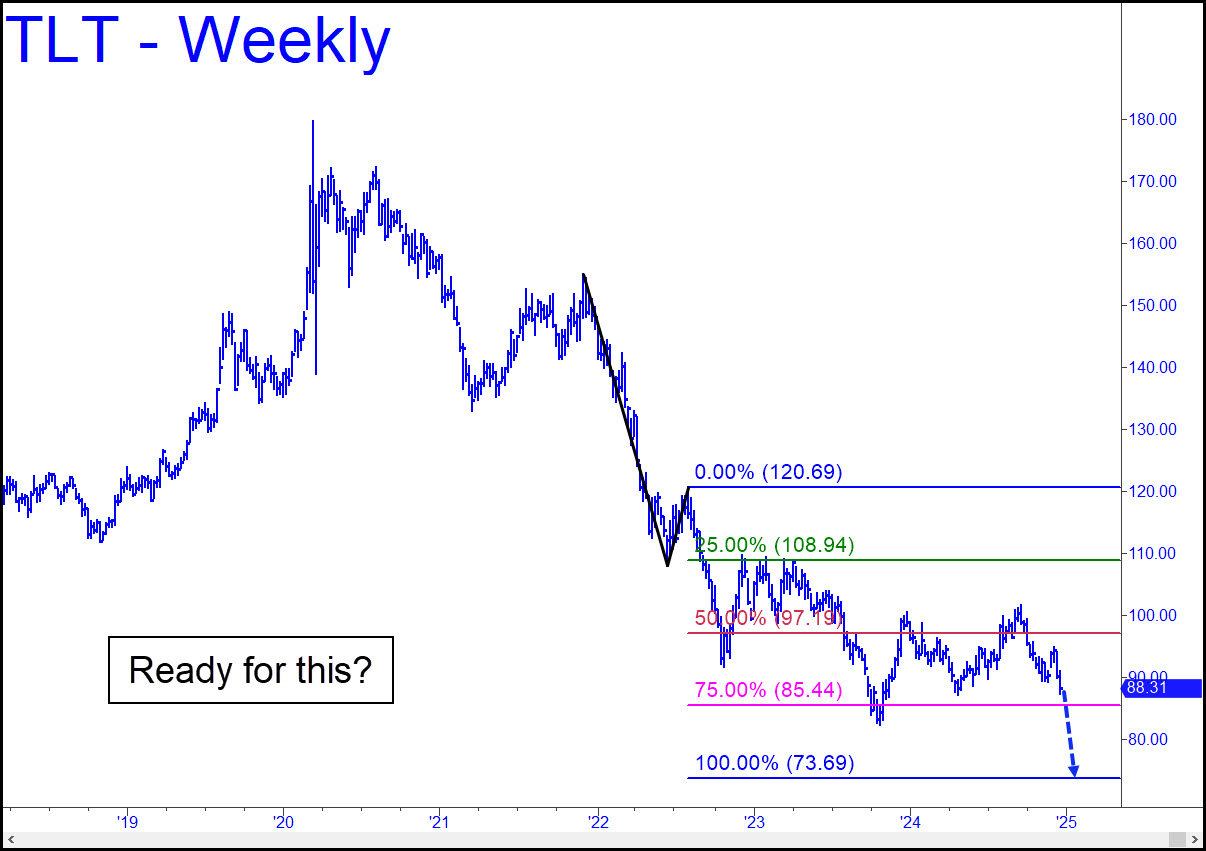
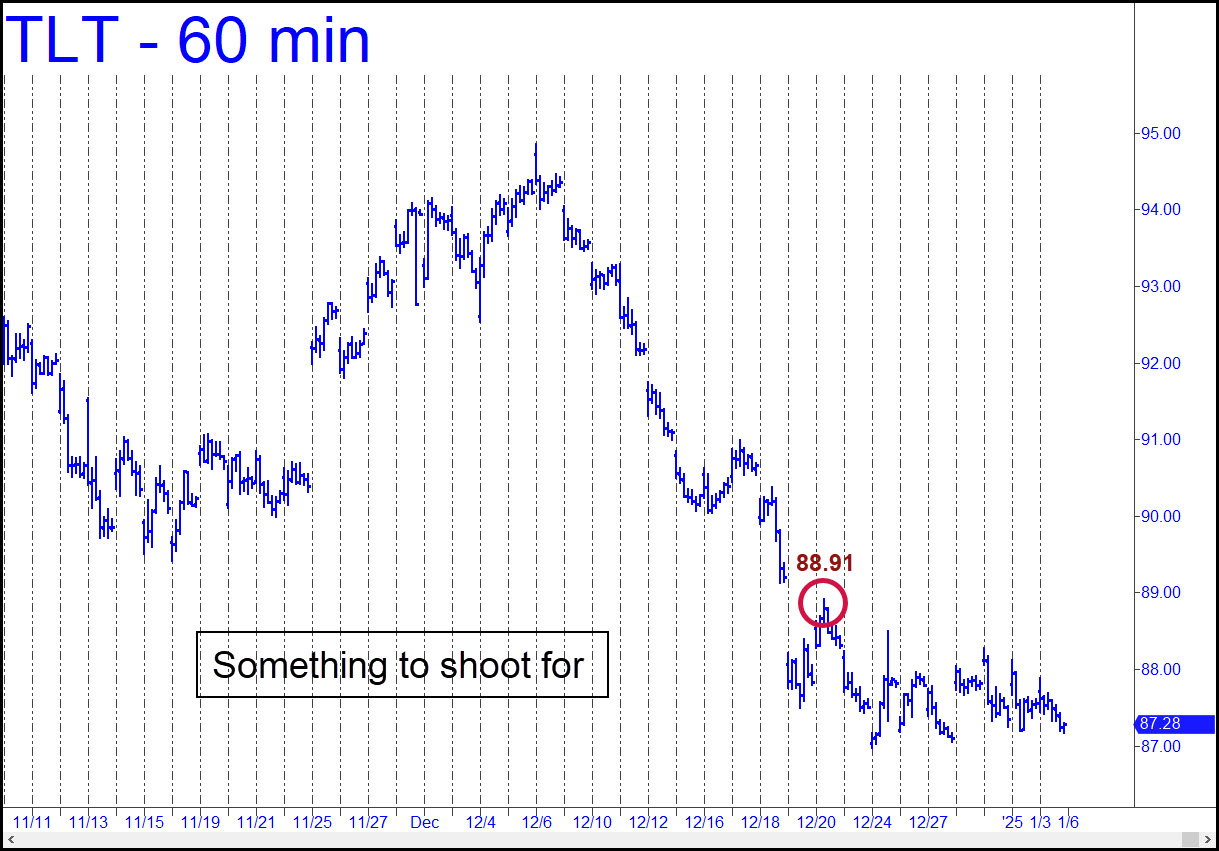
 I’ve lowered my target for Treasurys so often that it’s time to face the music. The 73.69 ‘D’ Hidden Pivot shown in the chart is where this ETF proxy for the long bond is probably going, and it is not a pretty picture. The punditry, editorialists and Bloomberg bozos can blather all they want about the economy’s supposedly soft landing, but this is wishful thinking. Interest rates are headed even higher, and this will crush markets that owe their artificial robustness to easy financing; cars and houses, to name just two. It will also turn the irreparable devastation in commercial real estate into a catalyst for the Second Great Depression. The chart pattern is too clear to deny, especially since it has already worked several times to produce profitable ‘short’ trades on the way down. A second test of p2=85.44 could conceivably turn this cinder block higher, but we shouldn’t look for miracles. ______ UPDATE (January 5): TLT continued to hover near death’s door, extending its distributive, sideways scuddle for another week. It would need to pop above 88.91, an external peak shown in this chart, to emerge from purgatory. _______ UPDATE (Jan 10): TLT stopped scuddling, the better to plunge anew. It ended the week with an imminent test in prospect of the 82.42 low recorded in October 2023. A two-day close beneath it would all but ordain more progress down to 73.69, a target that would have seemed unimaginable when this symbol spiked to a covid-era peak at 179.70 in March 2020.
TLT – Lehman Bond ETF (Last:85.46)
Posted on December 22, 2024, 5:23 pm EST
Last Updated January 15, 2025, 11:49 am EST
- December 27, 2024, 4:34 pm
Welcome aboard the downtown treasury train
Happy Hanukkah